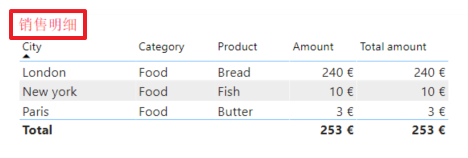
Automatic translation of visuals labels
Automatic translation of visuals labels in Power BI reports is possible using conditional formating, Tabular Editor and an Excel template. At the moment, labels are mostly titles. In the future, other labels will be translatable as soon as they will accept conditional formating (visual header tooltip, legend name, …).
Please watch this 4 mn video for an overview of the translation solution :
Download the project files and try “PBI translations” report
Step 1 : Install the Excel plugin
New version 07 2021 ! The Excel plugin works now on Office 32 and 64 bits. Translations are much faster !
Download the Excel addIn.
Extract files and run the “setup.exe” file
As the software is not signed, you will get a warning window. So click on the link and click on “Execute”.
You might use a trick from Vitaley in the comments in case you have issues with certificates.
- Open the Excel file
- A new tab “T-BI-P” appears
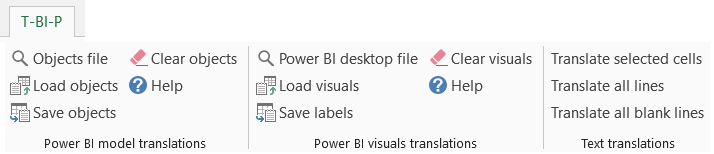
- Select the “Visuals” sheet

Step 2 : Load and translate labels in the Excel file
- Click on “Power BI desktop file” button and select the pbix or pbit file
- Click on “Load visuals” button so the plugin scans the report and populates the Excel sheet with its labels. Did you notice new labels are coloured in yellow ? I will explain it further in another post. The “Visual name” column contains the visuals id. The green column contains the labels text. This is your reference text which will be used as the source text for automatic translation
- Then you need to set the “Localization codes” with the sames codes you have in tabular editor
- Select “Translation languages” with the dropdown list
- Fill in the “Validators”. This is not mandatory but might be useful in case different people will validate translations
- Copy visuals labels into “Visual name” column. Even though this step is optional, it helps naming the measures in a readeable way
- Select a cell in the column to translate and click on the “Translate all lines” button to translate labels automatically
- Take care to validate translations or to ask validators to do it for you
- Then click on “Save labels” button. This will create the “TE objects.tsv” file. It will be used by Tabular Editor. A tsv file is a text file containing data separated by a tab character
Step 3 : Create measures in Tabular editor
The file created by the plugin will be used to create measures automatically in Power BI desktop using Tabular Editor.
Tabular Editor is a powerful tool for tabular model edition created by Daniel Otykier : https://tabulareditor.com/
Detailed presentation : https://powerbi.tips/2020/04/tabular-editor-rocks/
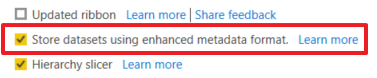
As the enhanced metadata format was in preview until september 2020, you might need to activate this feature in Power BI desktop settings under Options / Global / Preview features.
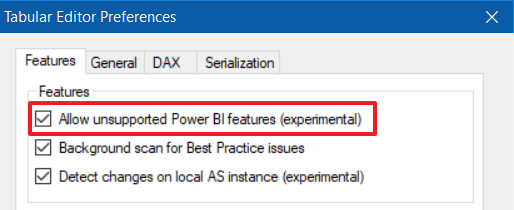
As long as the XMLA endpoint has writing limitations you need to activate this option in Tabular Editor’s preferences.
Please be careful using it and work only on copies of your reports. I suggest you activate these options carefully after tests and backups.
However, you can create measures manually or in an existing table until the XMLA endpoint will have no limitations.
Open a model in Tabular Editor. Please check it’s documentation in the wiki of the GitHub repository : https://github.com/otykier/TabularEditor/wiki
The script “Create visuals translations measures.csx” will create measures automatically into the model. It can be loaded into Tabular editor this way :
- Open “Advanced Scripting” tab
- Click on the “Open a C# script from a file”
- Review the parameters in the script
- Click on “+” button
- Give a name to the custom action and check at least the “Model” checkbox then click “Ok” button
- Click on the “Play” button when you want to execute the script or right click on the “Model” in the tree and select “Custom actions/your custom action name”
- Redo all these steps each time you get a new version of the script !
You noticed the “Method” parameter allows to select a method between “USERCULTURE” and “SLICER”. Be sure to read this post to understand the method which is more appropriate for your use case : https://thebipower.fr/index.php/2020/05/07/visuals-labels-translations-in-power-bi-reports/
The pbix file contains examples of both methods.
When you execute the “Create visuals translations measures” script, visuals labels are read from the “TE objects.tsv” file. For each label, a measure is created by Tabular Editor.
Save modifications to the model.
Step 5 : Modify visuals labels in Power BI desktop
Follow the steps in the following post and use the Excel file as a source for translations : https://thebipower.fr/index.php/2020/05/07/visuals-labels-translations-in-power-bi-reports/
Conclusion
Automatic translation of visuals labels in Power BI reports makes the translation process much easier. In an other post, I explain how to manage the translations life cycle. This way, you will be able to maintain translations easily when the report will evolve (visuals creation or deletion).
See also a post about automatic translation of tabular model (columns and measures names) : https://thebipower.fr/index.php/2020/04/12/automatic-translation-of-tabular-model/

Translations life cycle management
Translations life cycle management must be considered seriously as soon as we decide to translate…
Visuals labels translations in Power BI reports
Visuals labels translations in Power BI reports are not supported natively. However, there is a…
Automatic translation of tabular model
Automatic translation of tabular model using Tabular Editor and Excel is possible since the Power…
Hi Didier,
awesome post!
Everything works fine until I click on “Play” in the table editor. Then I get the following error message: “The action failed with the following error: Adding Calculated Tables to this Power BI model is not supported.”
Do you have any idea what could be the reason for this?
Thank you very much and best regards
Hello Max,
It seems to be an issue of Tabular Editor or of your script.
Do you use the latest version of Tabular Editor ?
Can you share your script so I can give it a try ? Please use the contact form in this website.
Regards
Didier
Bonjour Didier!
Merci pour ces instructions, c’est super.
I am experiencing the same error (” Adding Calculated Tables to this Power BI model is not supported”). Did you manage to figure out what the problem was?
I am on Tabular Editor 3, build 3.1.7950.37747 so should be the latest one, as I downloaded and installed it today for the first time.
Hello Sirte,
Please try to add a calculated table from Tabular Editor into your model without the script. If TE3 returns the same error, it doesn’t depend on the script. Try also on a pbix file in import mode. This must work.
Live connection might not allow to add a table.
Bonsoir! Thank you Didier for your response.
I got rid of the first error message by setting the experimental mode on (Tools / Preferences / Allow unsupported modelling operations). It was well hidden 😉
(I did manage to create a new calculated table without the script, as you suggested.)
I’ve now succesfully translated everything and created the new Visual translation measures with the script. However, when I hit “save changes back to the currently connected database”, go back to PBI Desktop and refresh, I still get this error in the translations: “Cannot find table Visual translations”. Should this table be created together with the measures?
Should this process work with TE3 without Premium or Embedded? From reading the TE3 help pages, it looks like I should be on a dedicated capacity to make changes to a PBI model, if I understood right?
Btw, does this way of creating the translations make then unsyncable from one tab to the other? At least looking at the Visual translations measures table, each title is its own measure.
Thank you so much for your advice!
Hello Sirte,
This solution works with TE3 or TE2 as soon as your report is in Power BI desktop.
Visuals translations table must be created manually. You can copy the query in my report and paste it into yours and then change the path of the Excel file.
I don’t clearly understand what you mean by “unsyncable”. Do you speak about slicers ? You can use the same measure for different visuals.
I also have another problem:
When doing the automated translation in Excel, I keep getting an error that says “Aborted after Internet connexion failure. Please retry”.
To continue, I actually need to restart Excel, and use Translate all blank lines. This does not seem like a viable way to finish the translation, as it does 30 lines per round and I have about 10 000 lines to translate…
Any suggestions on what is wrong? And what could I do to avoid this?
Sirte,
I cannot reproduce this error. Can you try after rebooting without launching any other software or can you try on another machine ?
Bonjour Didier,
Merci pour ce partage.
Je souhaiterai aller plus loin et changer le nom des colonnes aussi, est-ce possible ?
Bonjour Samy,
Je comprends que vous voulez traduire le nom des colonnes et mesures. Pour cela consulter le post suivant :
https://thebipower.fr/index.php/2020/04/12/automatic-translation-of-tabular-model/
Je vous conseille aussi de consulter ce post :
https://thebipower.fr/index.php/2020/07/05/translations-life-cycle-management/
Bonne journée
Thanks for the excellent post. What I understand the automated path of tabular editor cannot be used as yet. So in order to achieve translated text one had to write manual DAX for each visual header in a dashboard. Will explore your excel option to achieve this. Thanks.
Hello Triparna,
Thanks ! Tabular Editor can be used now to create the measures. It is a huge time saver.
To achieve it you need to activate XMLA endpoint in your Power BI desktop options. But XMLA endpoint is a preview feature with some cons which have been explained by Imke Feldmann (the link is in the post). So you can test the solution with a test report and it will work now. If you use your production report, make a backup of the report before you activate XMLA endpoint and be carefull of side effects. You might switch back XMLA option to off so your next reports will not be recorded in the new format.
At the moment, you will still need to go through your visuals to modify the conditional formating.
Regards
Hi Didier,
This looks awesome and is exactly what I am looking for. But it seems the Excel add-in won’t work on my machine. I can load the path of the example PBIX file located on my desktop but then nothing happens when I click on “Load visuals” except from cell D6 becoming grey. Would you have any idea of the issue?
Thanks for the great inspiring and helpful work you are doing.
Yannick
Hello Yannick,
Thanks a lot.
I have no idea why it doesn’t work on your machine. It must work at least with the example PBIX file. Did you modify it; I mean did you save it again ? What is your Power BI desktop version ? Is it the one from the store ? Is it the report server one ?
I will developp the same functionality in Power BI Sidetools with a log to better understand issues.
https://thebipower.fr/index.php/power-bi-sidetools/
Regards
Didier
Hello Yannick,
Thank you for the detailed bug report and thank you to help me to make the tool better.
– InteropServices.COMException :
I issued a new version. Please install it and tell me
– I cannot create measures in the PBIX file :
I updated the post
Did you activate this option in Tabular Editor’s preferences ? : “Allow unsupported Power BI features (experimental)”
Do you have an error ? I suppose the reason is it’s not supported yet to create calculated tables with XMLA endpoint. “Not supported” means it will work or not.
Have a look at this page : https://docs.microsoft.com/fr-fr/power-bi/create-reports/desktop-external-tools
Otherwise, replace this lines of Tabular Editor’s script (more secured way) :
// Delete the target table to build it again from scratch
if (Model.Tables.Contains(Target_table_name)) {
Model.Tables[Target_table_name].Delete();
}
Model.AddCalculatedTable(Target_table_name, @”DATATABLE(“”Fake column”” , INTEGER , {{0}})”);
var Target_table = Model.Tables[Target_table_name];
Target_table.Description = “This table is auto generated by a Tabular Editor script…
Target_table.SetAnnotation(“VTAUTOGEN”, “1”); //…
by this one :
Target_table_name = “an existing table name which will host the measures”
var Target_table = Model.Tables[Target_table_name];
FYI : The tool collects the visual titles (not headers)
Regards
Hi There
I am trying to veiw the sheets in the excel file: Readme, Model and Visuals. When I run the script from within the tabular editor, Excel opens but without those tabs…
Can you please help?
Hello,
It seems Excel is launched with an incorrect parameter.
Please tell me how you modified these lines in the Tabular editor script according to the location of the Excel file ?
var Objects_file = @”C:\Users\yourusername\Desktop\PBI translations\TE objects.tsv”;
var Excel_file = @”C:\Users\yourusername\Desktop\PBI translations\PBI translations.xlsm”;
Openning the Excel file from Tabular Editor is optional. You can comment this line and open the file manually:
//using(System.Diagnostics.Process.Start(Excel_file));
Hello
You are awesome! Its resolved. All the best.
Good luck with lockdown
Thanks a lot Didier for this awesome job!
Unfortunately that doesn’t seem to work on my computer and I’m stuck from step one 🙁
I didn’t manage to install the excel-addIn while I didn’t meet issue during the installation process
Eventually I don’t have the “T-BI-I” tab on my excel (version 2019)
Could you please help?
Merci d’avance 😉
Hello Sébastien,
Thank you. I don’t have your Excel version but please check the addin is activated in Options / Compléments (eventually select “compléments COM”)
Regards
Merci Didier pour ta réponse 🙂 (je réponds en anglais pour aider la communauté)
I had checked the add-ins section, but your add-in doesn’t appear.
I finally did it manually by following your instructions 😉
However I didn’t manage to translate the report pages labels? Any idea?
Merci encore pour ton site!!
Hello Sébastien,
I just tried and it worked for me. Did you follow the video precisely ? Otherwise, please send your Excel file to me so I can test it.
Joyeuses Pâques et merci pour ton support
Regards
Hello Sebastien,
I know it’s an older post, but could you please tell me what you did to install the add-in? It’s not working on my machine and I can’t seem to find a way to do it manually. Many thanks!
Hello Didier, thank you for this awesome tool.
I installed the plugin and opened the excel which was fine.
Then I searched for the PBIX file (also tried the example from the zip package) which also went fine
After this, I want to load the visuals but no luck the sheet stays empty ;-(
Any help on this?
Peter,
So you uncompressed the Zip package and installed the plugin.
Then you opened the xlsx file and you selected the “Visuals” sheet.
You clicked on “Power BI desktop file” button in the plugin toolbar and you selected the pbix file you got in the zip package.
The pbix file name appeared in the sheet (E1 cell) but when you click on “Load visuals” button in the plugin toolbar, nothing hapenned.
Am I right ? Do you have any error message ?
Good afternoon. I have the same problem. What could be the cause?
Hello Elizabeth,
Did you follow the steps I described just above ? Sheet selection is important.
Do you have any error message ?
All the steps have been completed. When the Load Visuals button is pressed, nothing happens.
So I understand you clicked on “Power BI desktop file” button and selected the pbix from the uncompressed zip file.
Then in E1 column, you can see the full path of the pbix and this path is correct.
Did you modify the pbix I provided ? What’s your Power BI desktop version ? What’s your Excel version ?
Power bi version 2.91.884.0 (March 2021)
Excel Microsoft 365 MSO (16.0.13929.20222)
Yes, everything is correct. The path is correct. Your pbix file has not been modified.
When you load visuals, the plugin creates a folder in the same folder where the xlsx file is located. This folder is named “Unzipped files”. It contains Json files.
Is this folder created ? If not, can you move the xlsx to your “Documents” folder and retry ?
I checked several times, the Unzipped files are not created.
If the “Unzipped files” folder is not created and if the xlsx file is in a folder with write access (like the “Documents” folder) then there is probably some protection established by your company administrators or by your antivirus.
You may try on other computers.
I tried to run the file from different directories. I also disabled the antivirus and tried it on two other computers. The result, unfortunately, is the same. Are there any other solutions to the problem?
Thank you very much in advance.
Saw your comment about the 32 system. I have 64 installed. I will try to change the office version.
Thank you very much.
Hello Elizabeth,
Thanks to Vitaley, I updated the Excel plugin. Now, it works in Office 64 bits and translations are much much faster.
Thank you Vitaley!
Hello Didier, when I try to reinstall the application I got the following error :
‘Customized functionality in this application will not work because the certificates used to sign the deployment manifest for the BI Power excel addin or its location is not trusted’
do you have a solution for this?
thanks a lot!
Hello Peter,
As the software is not signed, you will get a warning window. So click on the link and click on “Execute”.
Let me know if it works
Regards
Hello, Didier Terrien. Thanks for your add-in, i have a small guide for people who have a problem with certificates (“Customized functionality in this application will not work because the certificates used to sign the deployment manifest for the BI Power excel add-in or its location is not trusted”) and don’t have an “Execute” button.
Workaround:
1. Open Internet Explorer – “Settings” – “Internet Options”
https://i.imgur.com/z9Cmo7M.png
2. Click on tab “Security” – select “Trusted sites” – add “127.0.0.1” to trusted sites – “Close” – “Ok”
https://i.imgur.com/LLhnezo.png
3. Open Explorer – in address panel type: \\127.0.0.1\c$ – find “The-BI-Power-Excel-addIn” folder (in my case i unzipped it to “C:\The-BI-Power-Excel-addIn”) – you should have path like (\\127.0.0.1\c$\The-BI-Power-Excel-addIn) – now just open “setup.exe”, in warning window press “Install”
https://i.imgur.com/1U4CfRw.png
You can add it to your guide if you want 🙂 will glad if it helps.
Thank you Vitaley ! I added in the post a reference to your comment
Hi. I’m trying to translate data from my report. I choose a file – I download the data – I press “Translate all lines” – the first column translates perfectly, and on the second and each following I receive an error “Aborted after Internet connexion failure Plase retry”
Hello Pavel,
Can you share your file ?
Hello..
I’m also facing same issue.
any work around for that?
Hello Bhushan,
It’s working here. Can you share your Excel file ?
Hello Pavel,
did you find any solution to your issue ?
Hi Didier Terrien,
Option not available to share/attach excel file in the replay.
Hello,
I had this error right after starting to translate “Aborted after Internet connexion failure Plase retry”
did anyone solve this issue ?
Hello Samaha,
What is your plugin version ? It’s written in the “TBIP” ribbon
Monsieur TERRIEN,
Le vous nous demandez dans les etapes de sélectionner un fichier pbi après avoir ouvert le fichier excel. Ce que je ne comprends pas , dans votre video, vous choisissez plutot un fichier PBI translation before. d’où vient ce fichier ? je m’attendais à ce que vous sélectionnez le PBI translations.
Steve,
Le nom du fichier n’a pas d’importance
M TERRIEN
here is what I get when I load the visuals after installing the plugin:And error occured in the power BI Excel plugin.Please contact us at this adress: https://thebipower.fr/index.php/contact/ .
can you help me please?
steve
Hi Didier,
I have installed the plugin using the link provided in blog. But I am not able to see any T-BI-P option when i open my excel file. Is there ant specific excel template file which needs to be downloaded? Where can i get that file.
Could you please help me.. Is there any latest excel plugin can you share the link?
Hello Rohit,
The Excel file (PBI translations.xlsx) is available at the top of this page (Download the project files and try “PBI translations” report)
After plugin installation, a new tab ‘T-BI-P’ must appear in Excel ribbon. If it doesn’t appear, please check if the plug in is activated in options.
Hi Didier TERRIEN,
Got the excel file thanks for the quick response.
But in the excel file I am not able to se T-BI-P tab I have installed the plugin, also in the Add-in option I don’t see any Power Bi related add in option. I can see the files in program folder under “The BI Power Excel Add in” folder tried to add .dll files to COM add-in manually I get the following message- ” The BI Power Excel addIn.dll is not valid OFFICE add-in”.
Can you please help me with the plugin.
I have excel 2212 version.