DAX debugger in Power BI Sidetools
DAX debugger is meant to help Power BI report developers displaying sample data from a DAX formula. Measures, calculated columns and calculated tables can be debugged very easily without impact on calculation performance. An advanced mode allows user to fine tune how data is displayed.
This demo will use the Contoso model provided by Microsoft here : https://www.microsoft.com/en-us/download/details.aspx?id=46801
Simple debug mode
As a beginning, the examples will debug a measure. DAX debugger will work almost the same with calculated columns and caculated tables.
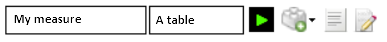
Simply type the measure name and the table name against you want to evaluate the measure. Intellisense will propose what is available in the model.
Then click on the green ‘Play’ button to start the debugging session.
Lets start writing a very simple measure :
Sales lines =
COUNTROWS ( Sales )
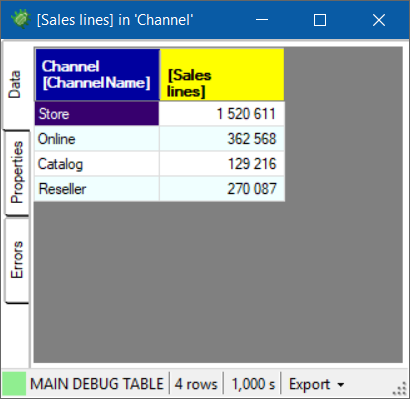
Then lets ask the debugger to display the measure in the sales table.
The ‘Play’ button turns to red to let you stop the debugging session.

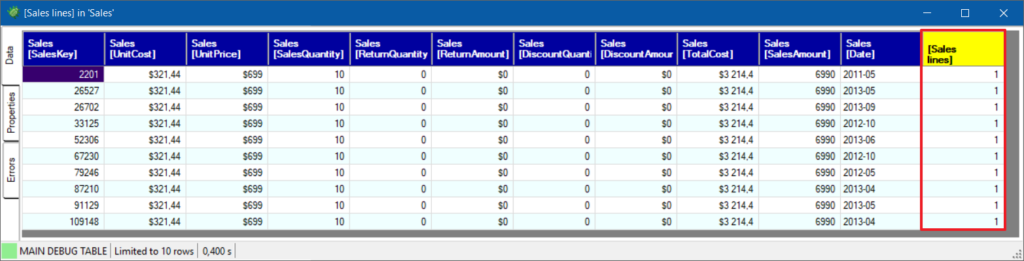
You can move columns and sort by any column. You can select cells and copy using CTRL C then you can paste it anywhere using CTRL V.
Tabs on the left side allow you to view query properties and error.
For performance purpose, the debugger displays a subset of the whole result. Lines number is limited to 30 by default but you will be able to change this limit.
Now, lets say you want to display the measure in ‘Channel’ table.
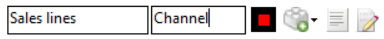
No need to stop the debugger. You just need to modify the table.
The debug table is modified automaticaly
A very good practice writing DAX is to use variables. DAX debugger will help you even more if you do so.
Sales lines =
VAR Var1 = COUNTROWS ( Sales )
VAR Var2 = 2 * Var1
RETURN Var1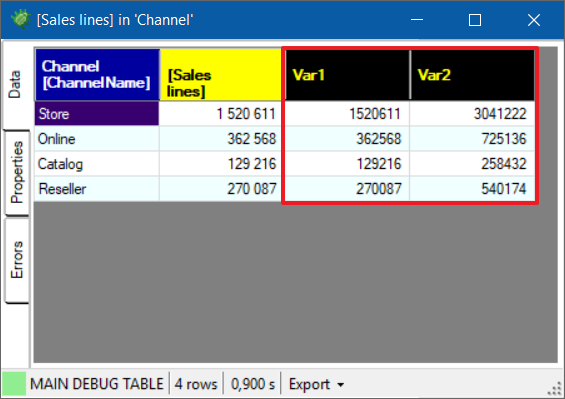
As soon as you validate the measure in Power BI desktop, variables are displayed close to the measure
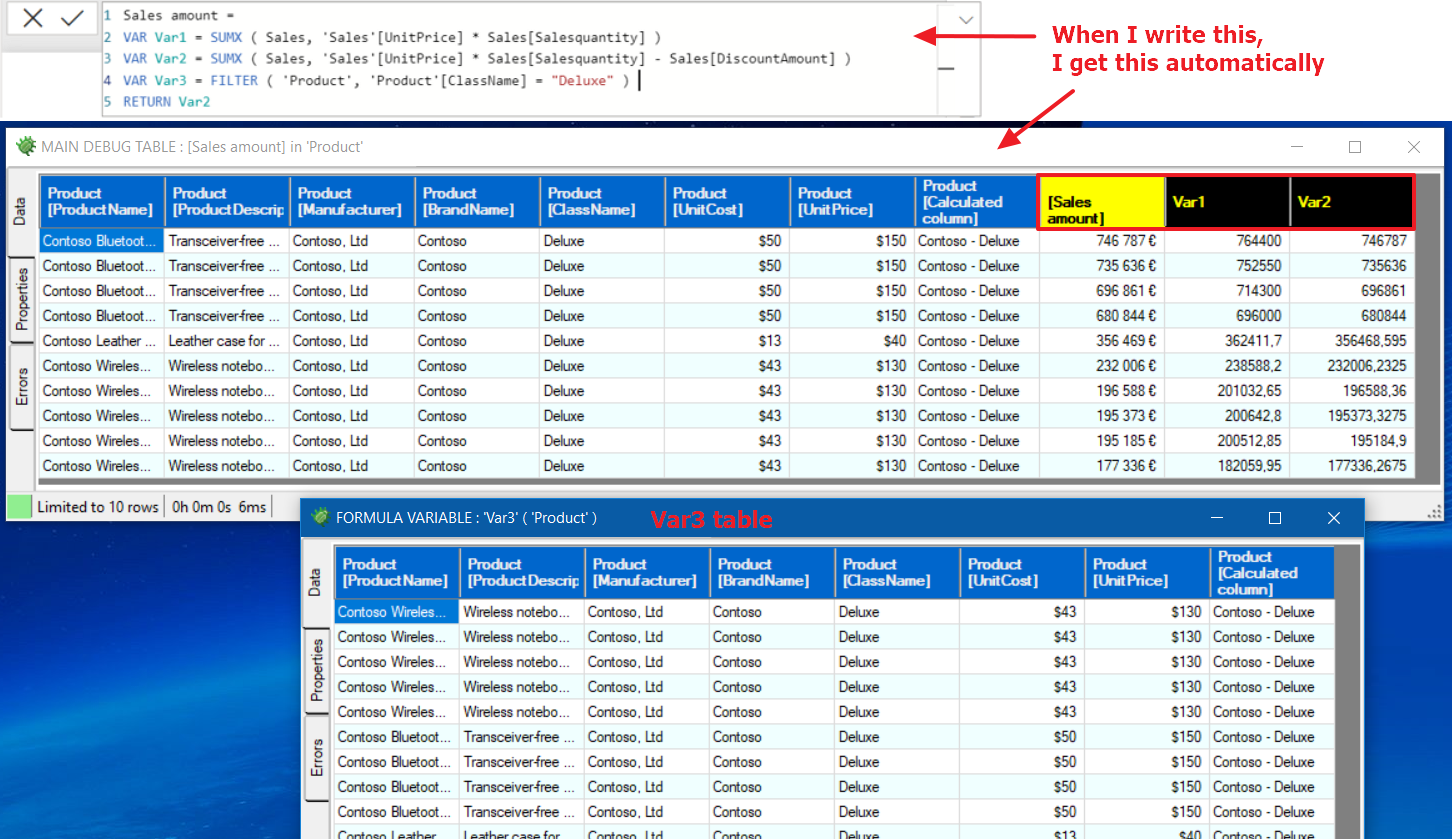
If your variable is a table, it will be displayed in an other window.
Sales lines =
VAR Var1 = COUNTROWS ( Sales )
VAR Var2 = 2 * Var1
VAR Var3 = FILTER( 'Product', 'Product'[BrandName] = "Contoso")
RETURN Var1
In the simple debug mode, the specified table will be the debug context. You may fine tune the debug context and other parameters in the advanced mode.
Advanced debug mode
You have the possibility to give instructions to the DAX debugger using keywords and DAX variables.
Modify displayed rows limit
The simplest instruction is DBG_ROWS_LIMIT in order to change the maximum rows number displayed in a debug table.
Sales lines =
VAR Var1 = COUNTROWS ( Sales )
VAR DBG_ROWS_LIMIT = 2
RETURN Var1
You can also comment debug instructions so they will have no impact on your model. The debugger will still read these instructions.
Sales lines =
VAR Var1 = COUNTROWS ( Sales )
//VAR DBG_ROWS_LIMIT = 2
RETURN Var1
You may hide instructions to the debugger adding an other slash.
Sales lines =
VAR Var1 = COUNTROWS ( Sales )
///VAR DBG_ROWS_LIMIT = 2
RETURN Var1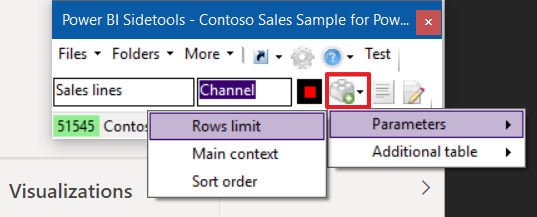
If you don’t remember instructions, you may find them in the snippets menu.
The snippet will be copied into the clipboard. You just need to paste it within your measure and adapt it as you want.
//VAR DBG_ROWS_LIMIT = YourLimitYour instructions may be kept in the formula so the next time you want to debug the measure, you just need to run the debugger.
Modify the debug context
Since now, we used the selected table as a debug context. You may define define it as you like with a DAX formula which might be simple or complex.
Add a DBG_MAIN_CONTEXT instruction to setup the debug context and eventually add a filter.
Feel free to modify the formula as long as it returns a table.
Sales lines =
VAR Var1 = COUNTROWS ( Sales )
//VAR DBG_MAIN_CONTEXT = FILTER( 'Product', 'Product'[ClassName] = "Deluxe" )
RETURN Var1
Add a DBG_MAIN_SORT_ORDER instruction to define an order. Use ASC or DESC.
DBG_MAIN_SORT_ORDER cannot be used without DBG_MAIN_CONTEXT.
Sales lines =
VAR Var1 = COUNTROWS ( Sales )
//VAR DBG_MAIN_CONTEXT = FILTER( 'Product', 'Product'[ClassName] = "Deluxe" )
//VAR DBG_MAIN_SORT_ORDER = 'Product'[UnitCost] DESC
RETURN Var1
Add other windows to display more tables
Add a DBG_TABLE_xxx instruction to display another table. Replace xxx with a unique name. You may add several DBG_TABLE_ instructions as long as the table name is different.
Sales lines =
VAR Var1 = COUNTROWS ( Sales )
//VAR DBG_TABLE_Sales = TOPN(30, 'Sales')
//VAR DBG_TABLE_Locations = ADDCOLUMNS( VALUES('Geography'[ContinentName]), "Lines", [sales lines] )
RETURN Var1
Actual limitations
At this moment, the DAX debugger will not evaluate variables when variables are nested in a condition or an iteration.
What’s next
More features are planned or already under test :
- Export the whole query result from a debug table to Excel
- Format the DAX code with DAX formatter
- Edit the DAX formula within Visual Studio Code and transfer it into Power BI desktop report
- Get a performance evaluation
Feel free to propose an idea or to share your experience in GitHub : https://github.com/didierterrien/Power-BI-Sidetools/discussions
Please report issues in GitHub : https://github.com/didierterrien/Power-BI-Sidetools/issues
Get an overview of Power BI Sidetools : https://thebipower.fr/index.php/power-bi-sidetools/
Custom analyser
With ‘Custom analyser’ feature, Power BI Sidetools users can use external tools built by the…
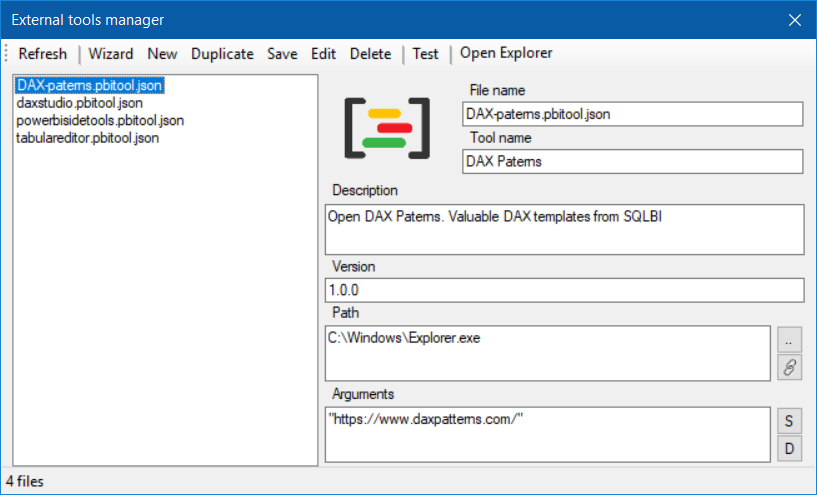
Manage your external tools easily with Power BI Sidetools
Since the Power BI team allowed to launch external tools from the Power BI desktop…

Easily export to Excel with Power BI Sidetools
While working in Power BI desktop, we often need to export to Excel some data…
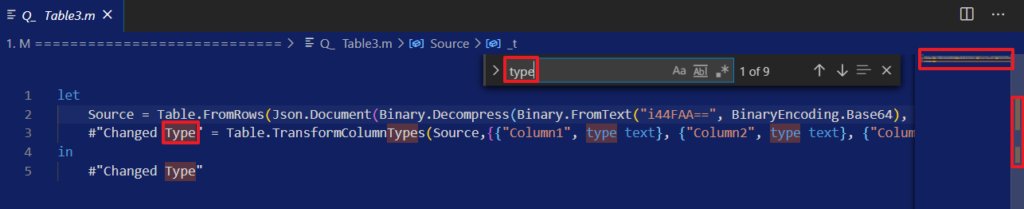
Powerful text and file search in Visual Studio Code
As Power BI Sidetools creates files from your report, you are able to search through…
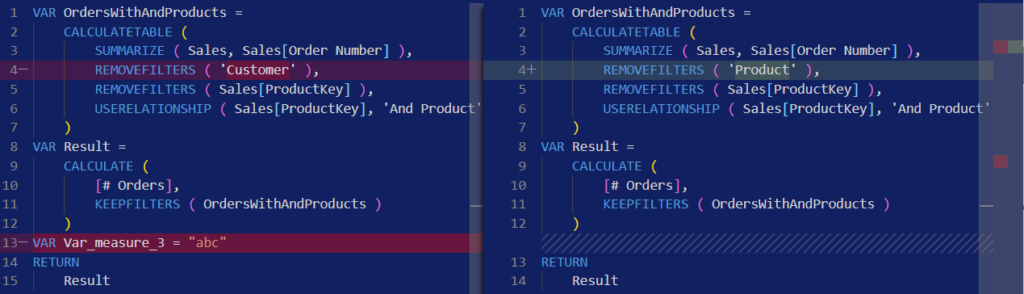
Compare DAX and M formulas in Visual Studio Code
Compare DAX and M formulas in Visual Studio Code is really easy with the help…
One Comment