
Custom analyser
With ‘Custom analyser’ feature, Power BI Sidetools users can use external tools built by the community.They may create their own Power BI external tool. The process is incredibly quick and simple. An icon can be added in the desktop ribbon so your brand new tool can be run in one click. Tools can be built in Pbit or Excel files. You will be able to share these files freely. Examples are provided so you start immediately with a result. Possibilities are infinite ; I can’t wait to see what you will do with it.
Custom analyser concept
Everything starts from an opened Pbix report you want to analyse. Any custom analyser must be run from this report.
Running the ‘Custom analyser’, Power BI Sidetools simply exports a bunch of files describing the opened Pbix report. Most of files are already familiar to experimented users but we also added simplified files exposing very obvious items.
Then, Sidetools opens an available custom analyser which uses exported files. The refresh is automatic.
Your first steps
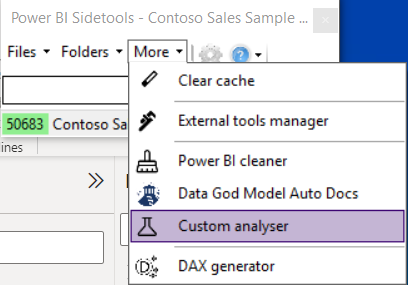
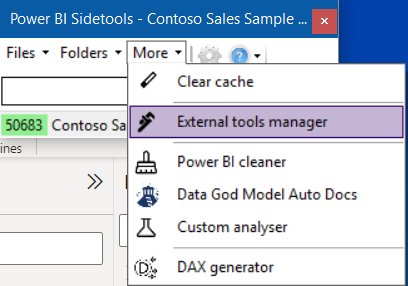
In the ‘More’ menu, select ‘Custom analyser’
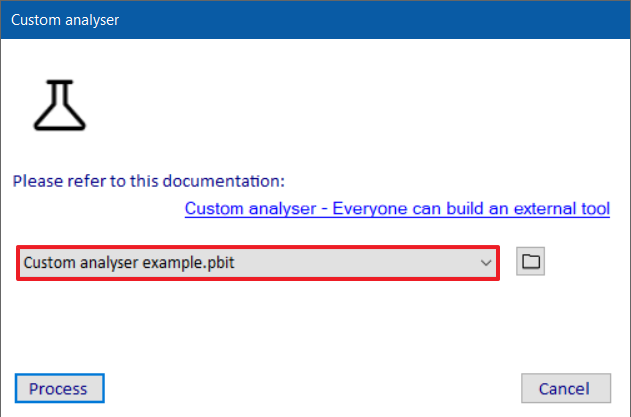
Select a custom analyser in the drop down list and click the ‘Process’ button
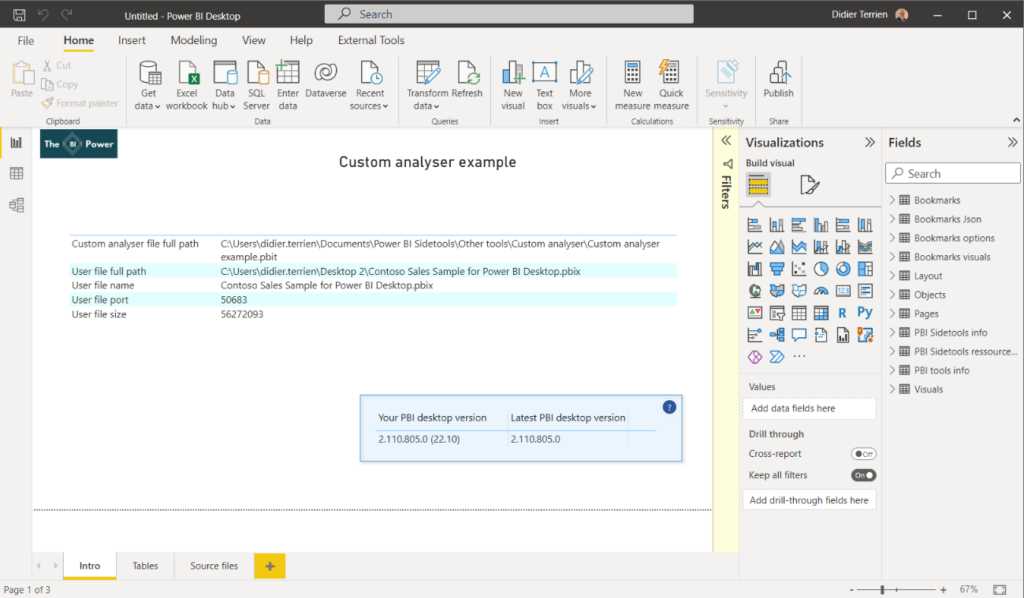
The Pbit file is loaded and refreshed automatically
Create an icon in desktop’s ‘External tools’ ribbon
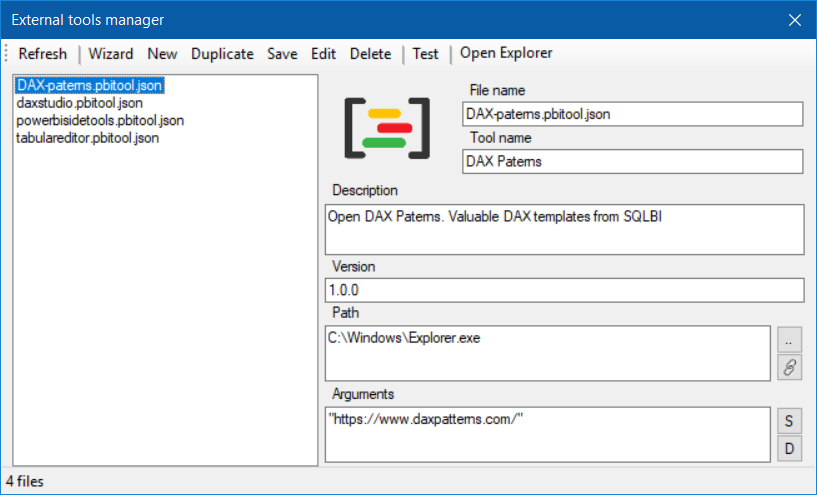
In the ‘More’ menu, select ‘External tools manager’
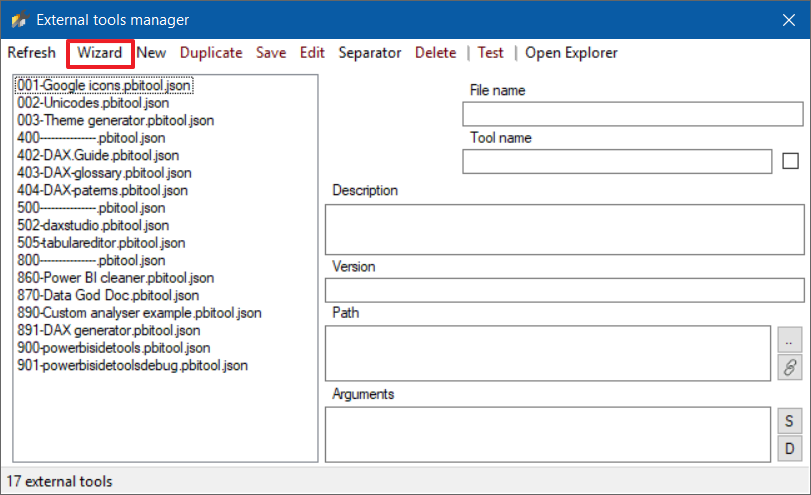
Click on ‘Wizard’ button
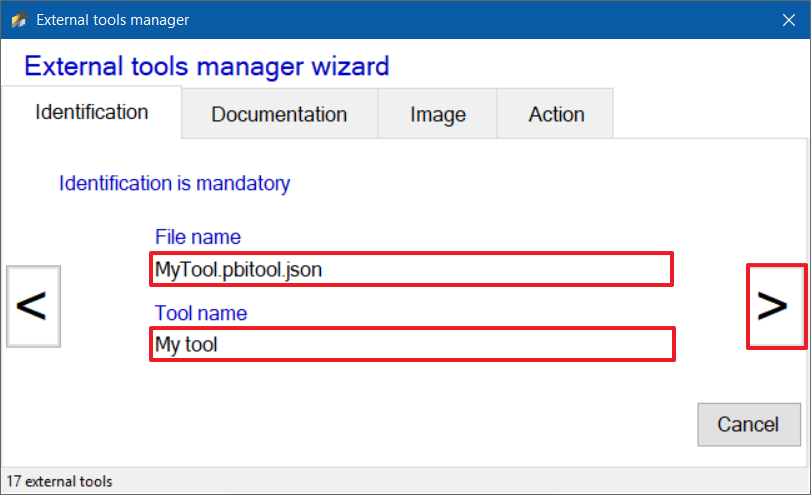
- Type in a file name which will be used to sort icons in ‘External tools’ ribbon
- Type in a tool name which will be displayed under the icon
- Click on the right arrow to go to next step
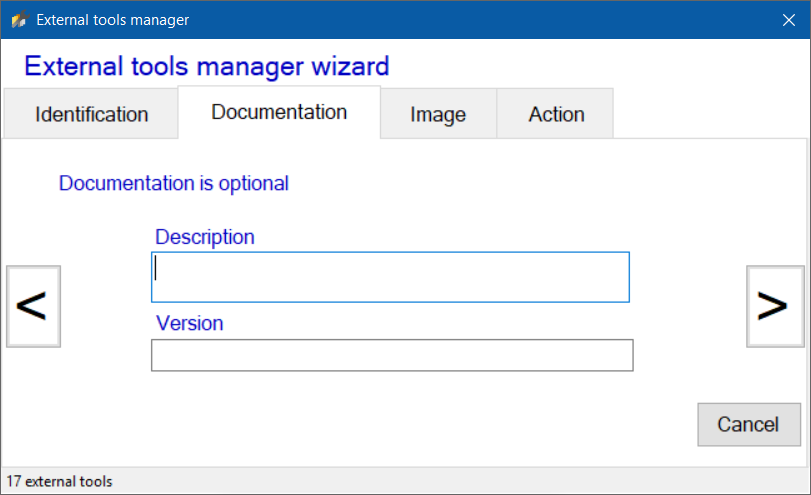
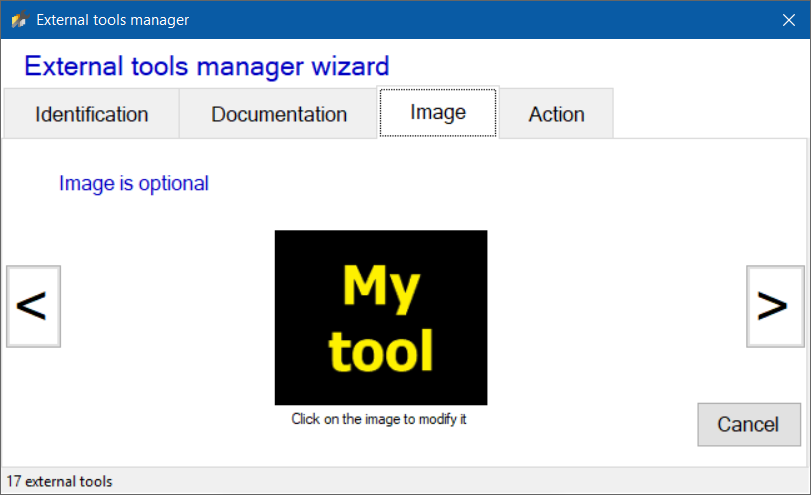
Optionally fill in description and version
Optionally, click on the image and select the image file you want. Otherwise, a default image will be used
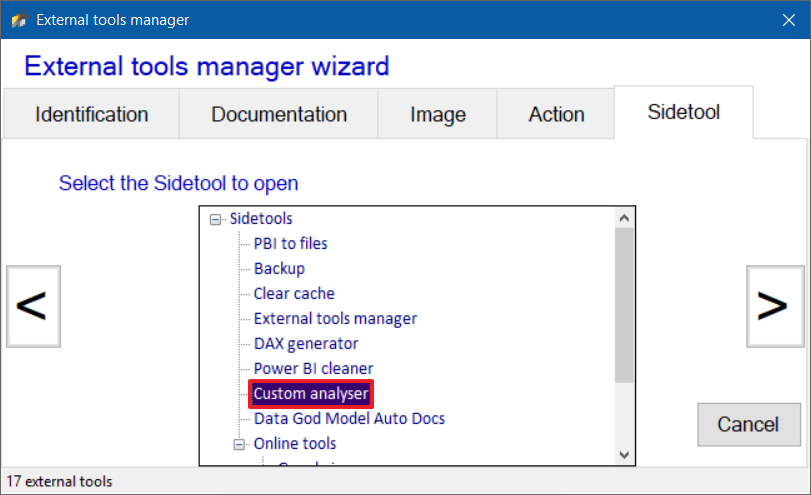
Select ‘an individual Sidetool’

Select ‘Custom analyser’
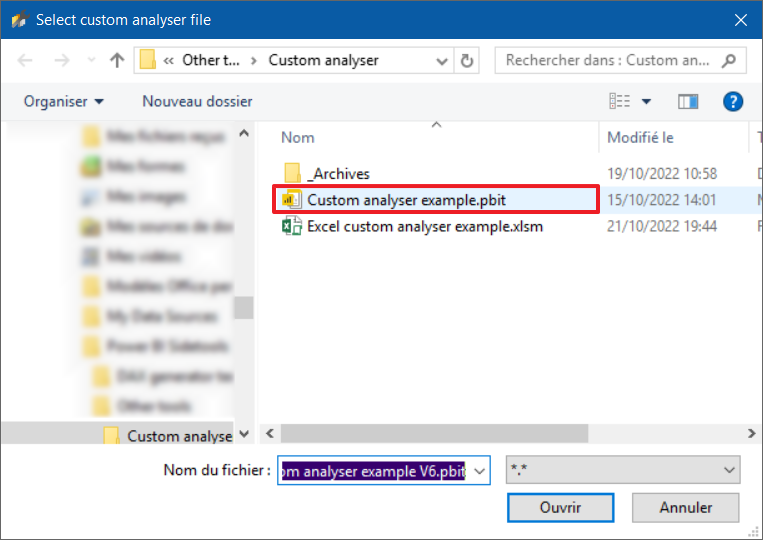
Select a custom analyser file
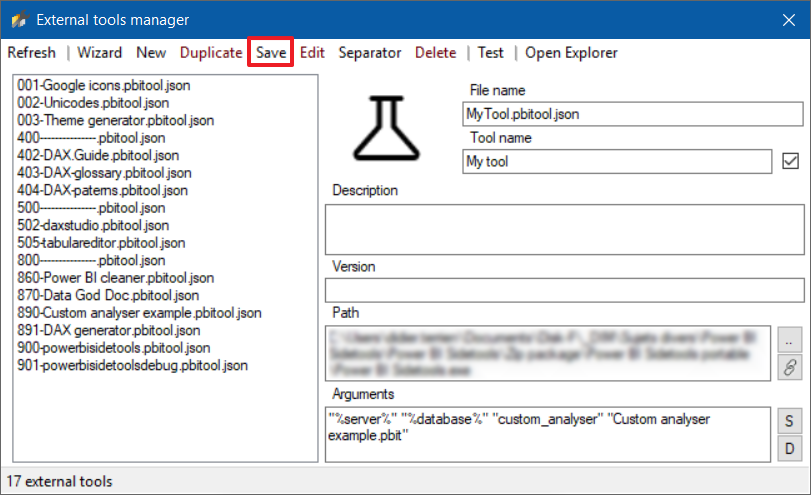
Review the settings and save
- Close Power BI Sidetools
- Close the Pbix file
- Reopen the Pbix file
- You are ready to open the custom analyser with only one click
More details about External tools manager : Click here
Get more custom analysers or share yours
Custom analysers are Pbit or Xlsm files. You reach them clicking on the folder icon. You can move and share these files as you want
Featured external tools
Power BI Sidetools natively includes a set of expert tools built by advanced users:
- ‘Power BI cleaner’ by Imke Feldmann
- ‘Data God Model Auto Docs’ by Chris Wagner
- ‘Bookmark Documenter’ by Reid Havens
Big up to these valuable people who share their tools for free with the community !!!
Create your own custom analyser
The easiest way to create a custom analyser is modifying an existing one.
- Open a custom analyser with Sidetools
- Modify it
- A best practice is to reference existing queries so it will be easier for you to update them with copy/paste
- In order to save it:
- select ‘File / Export / Power BI template’
- in ‘Export a template’ window, fill in the template description and click ‘Ok’ button
- name your Pbit file and click on ‘Save’ button. Please be aware files published by Sidetools are overwritten each time a custom analyser is run. So use different names to save your own custom analyser
- It’s not necessary to save the ‘Untitled’ report
Use more resource files
Some resource files are not loaded in the published example but you can see the list of available files in the ‘PBI Sidetools resource files’ query. For example, if you want to load the theme used by the Pbix, follow these steps in Power Query:
- Select the ‘Source folder’ query
- Copy the source folder path in the clipboard
- In the ‘Home’ ribbon of the desktop, click on the ‘New source’ button
- Select a source type (‘Json’ for our example)
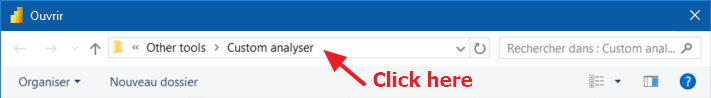
- When the file explorer window appears, paste the source folder path into the path selector at the top of the window and type ‘Enter’ key
- Navigate to this sub folder : ‘Unzipped report\Report\StaticResources\SharedResources\BaseThemes’
- Select the Json file
- Modify the ‘Source’ step replacing the hard coded path with the ‘Source folder’ query:
= Json.Document(File.Contents(#"Source folder" & "Unzipped report\Report\StaticResources\SharedResources\BaseThemes\…"))
- Then you can parse the Json
- I recommend opening the Json file in ‘VS Code’ in order to understand its structure. The extension ‘JSON Tree View‘ from ChaunceyKiwi is highly recommended also
When opening a csv file, don’t forget to use a relative path and to set the ‘QuoteStyle’ parameter to csv :
DMV_Columns = Csv.Document(File.Contents(#"Source folder" & "DMVs\TMSCHEMA_COLUMNS.csv"),
                                        [Delimiter="#(tab)", Encoding=1200, QuoteStyle=QuoteStyle.Csv]),
Exported files
Exported files can be grouped in several categories:
- General information like Pbix file size and path, your Power BI version and the one available for download. Some information is provided with the help of the fantastic PBI Tools from Mathias Thierbach.
- Model like the ‘Model.bim’ file ready to be parsed. ‘M expressions.csv’ contains all queries.
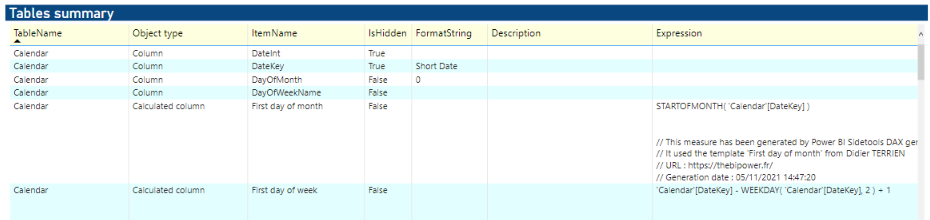
- Layout like the visualisation layer within ‘layout’ Json file or even a more readable version. But there is also a simplistic list of visuals with their visibility status plus their coordinates, sizes and page.
- DMVs like ‘TMSCHEMA_MEASURES.csv’ containing measures defined within the Pbix with their description, expression, display folder, visibility status, format string, … More DMVs will be added on request.
- Unzipped report files. Sidetools unzips the Pbix and exposes its files. This way, for example, you may calculate how many bytes are used by images or custom visuals. You can also parse theme, metadata or settings. The ‘DataModel’ file is not exposed because it might be huge as it contains data
If you need more files, please submit an issue in GitHub
Test version
The test version is available here : https://github.com/didierterrien/Power-BI-Sidetools/releases
Select the first asset and unzip it any folder you want. You may have different versions in different folders. Each version has it’s own settings.
Open the report you want to analyse in Power BI desktop.
Execute ‘Power BI Sidetools.exe’ from the unzipped folder. Sidetools will connect automatically to the opened Pbix. If multiple Pbix are opened, Sidetools will let you select the one you want to connect.
In case the test version doesn’t come with the updated version of a custom analyser you want to test, you can drop the new version in ‘C:\Users\username\Documents\Power BI Sidetools\Other tools\Custom analyser’ folder
If you create an icon in desktop’s ‘External tools’ ribbon from the test version, be aware they will only open the test version you are testing. A good practice is to set an icon name beginning by ‘Test’
Under the hood
What is happening when you run a custom analyser ?
Pbit custom analyser
When you click on ‘Process’ button while a Pbit is selected, Power BI Sidetools follows these steps :
- create resource files from the Pbix using PBI Tools from Mathias Thierbach
- create resource files from the Pbix :
- unzip the Pbix file
- run several DMVs and export them to csv files
- export the Model.bim file and ‘M expressions.csv’ file
- export the ‘Layout’ file and more readable versions of the layout (‘Readable layout.json’ and ‘Visuals visibility.csv’)
- create resource files from the Pbix using Sidetools’ internal features
- create a file listing all available resource files (‘Files and folders.csv’)
- extract the selected custom analyser Pbit with PBI Tools
- modify the custom analyser Pbit file in order to update the ‘Source folder’ query
- compile the selected custom analyser Pbit with PBI Tools
- open the selected custom analyser
- wait for selected custom analyser refresh
Xlsm custom analyser
The Xlsm custom analyser example is available if you prefer to create an Excel custom analyser
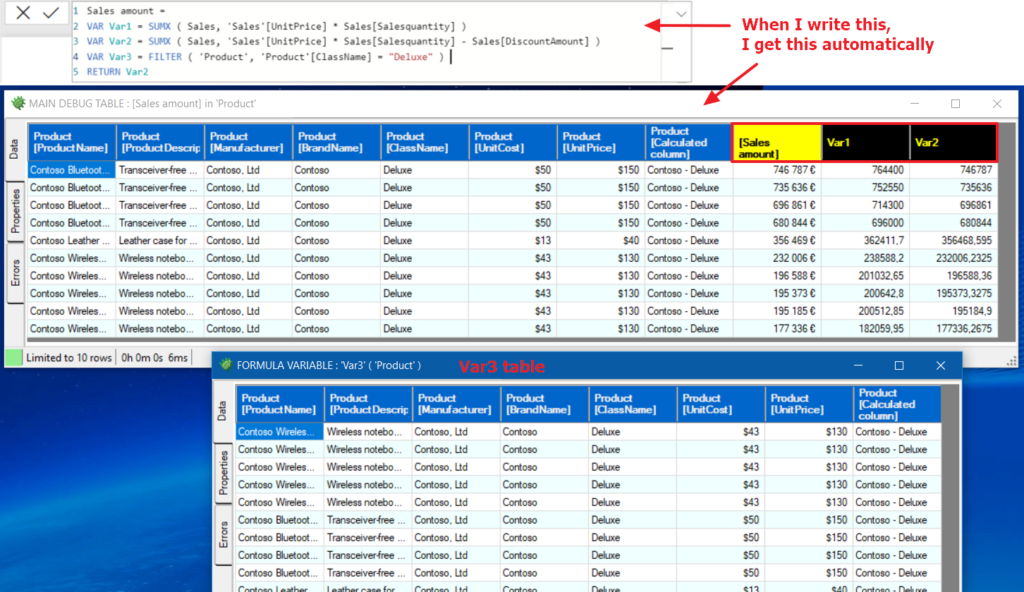
DAX debugger in Power BI Sidetools
DAX debugger is meant to help Power BI report developers displaying sample data from a…
Manage your external tools easily with Power BI Sidetools
Since the Power BI team allowed to launch external tools from the Power BI desktop…

Easily export to Excel with Power BI Sidetools
While working in Power BI desktop, we often need to export to Excel some data…
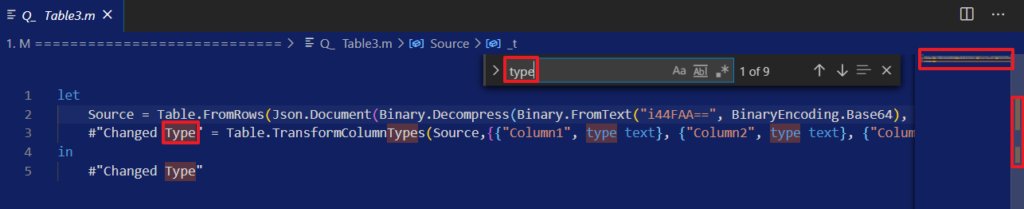
Powerful text and file search in Visual Studio Code
As Power BI Sidetools creates files from your report, you are able to search through…
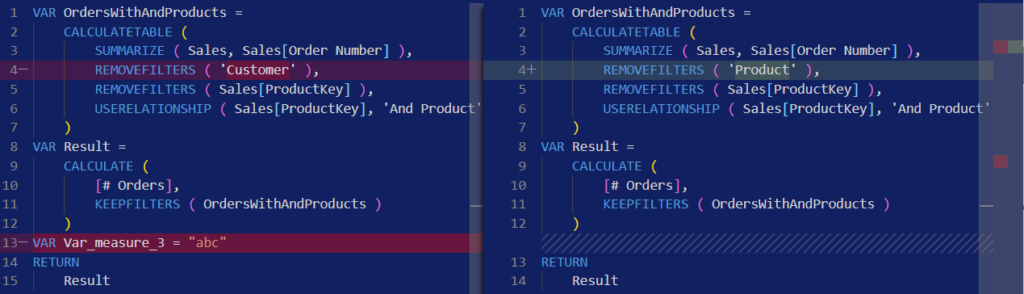
Compare DAX and M formulas in Visual Studio Code
Compare DAX and M formulas in Visual Studio Code is really easy with the help…