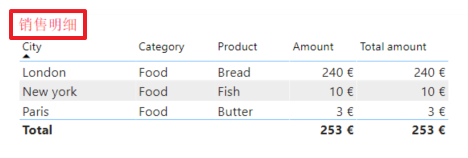
Easily export to Excel with Power BI Sidetools
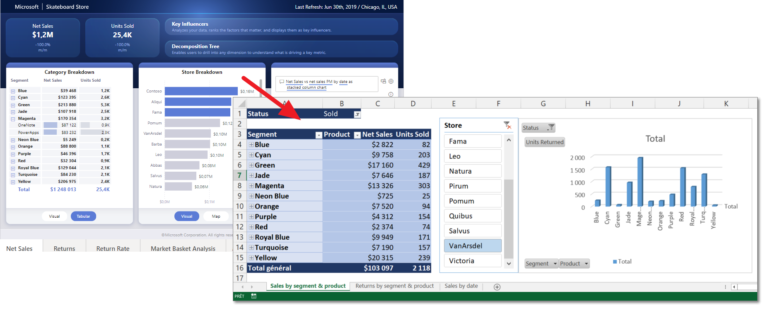
While working in Power BI desktop, we often need to export to Excel some data sharing with customers or colleagues. Once shared, we don’t want these users to refresh the data. Coming with version 1.1.0, Power BI Sidetools exports your data into Excel with only one click. Then you can setup pivot tables, add theme…