The BI Power provides services about Microsoft Power BI (Power BI desktop, Power Query, …). Please have a look at our blog posts to get some amazing content about these wonderful tools.
Power BI Sidetools
Power BI desktop
Power Query
The BI Power blog posts :
Custom analyser
With ‘Custom analyser’ feature, Power BI Sidetools users can use external tools built by the…
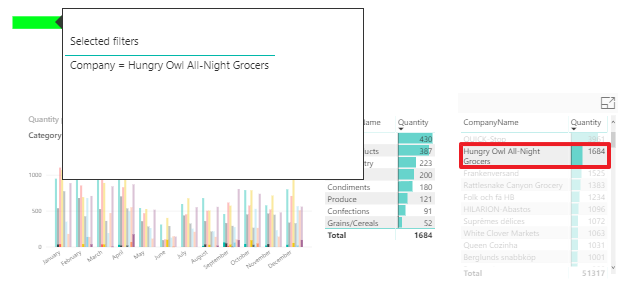
4. Add a tooltip to display applied filters
Once you know your report is filtered having a look at the green light, you…
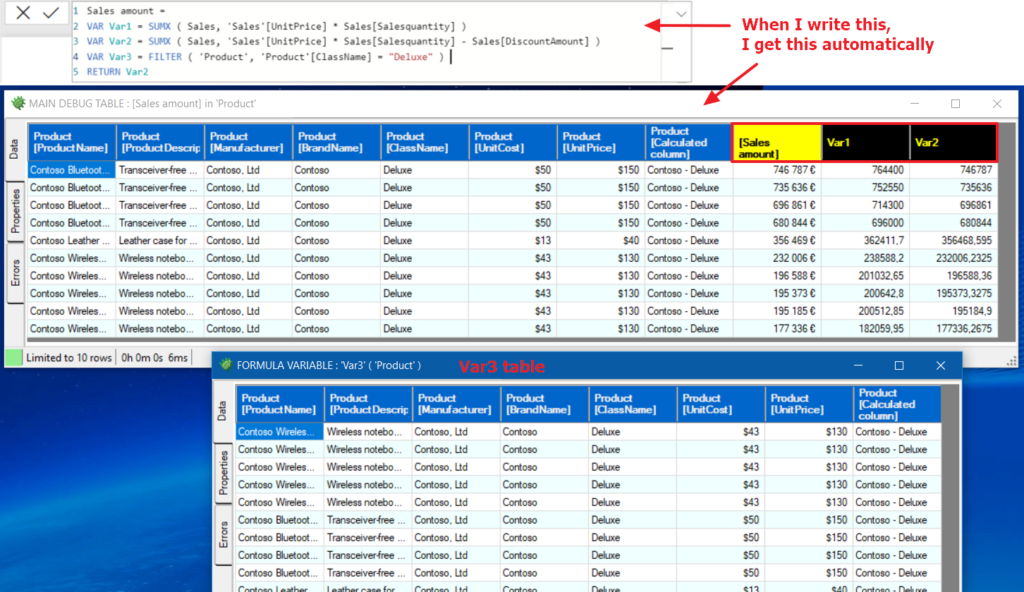
DAX debugger in Power BI Sidetools
DAX debugger is meant to help Power BI report developers displaying sample data from a…
Power platform roadmap
Do you want to check the features which will be developped during the next months…
Compare the same data from two columns in Power Query
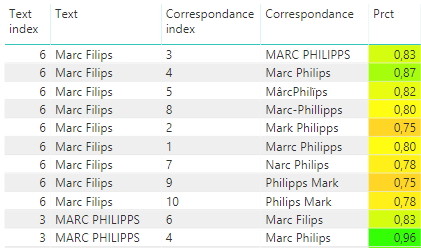
Sometimes, it is useful to compare the same data from two columns. So, here is…
Augmented reality with Power-BI reports
Imagine to view reports in your glasses and control them with your hands. Use augmented…
Add a refresh date to your report
Final users need to know when the report has been refreshed for the last time….
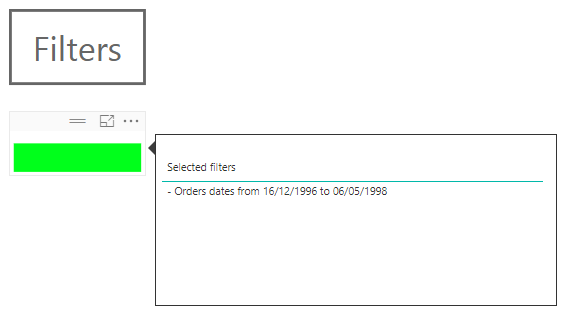
5. Add your filtered date range in the tooltip
Don’t forget to add your filtered date range in the tooltip. This is one of…
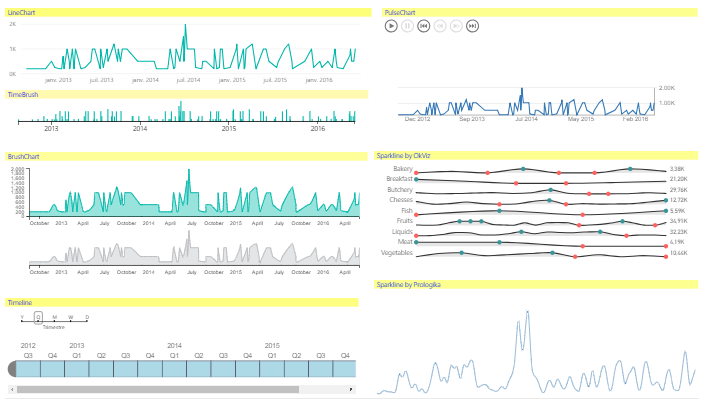
Visuals test
It’s sometimes useful to compare visuals functionalities. This report is only made for that :…
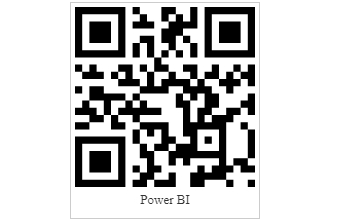
Get insights on your phone from data matrix sticker
In Power BI service, you can print a data matrix as an ID of your…
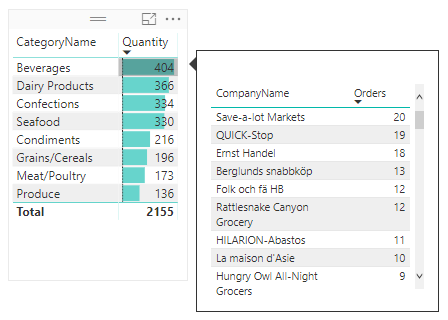
Add a tooltip page in your report
A really efficient way to get immediately more insights is to use a tooltip page…
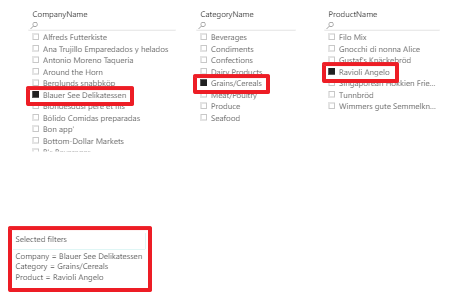
3. Display filters applied to data
To understand properly our data, the very first thing we need to do is to…
M functions documentation within Power Query
Often we look for the documentation of a function or we even look for a…
Export Power-BI desktop data to Excel
Export Power-BI desktop data to Excel with R. This R script exports a Power BI…
Easily export to Excel with Power BI Sidetools
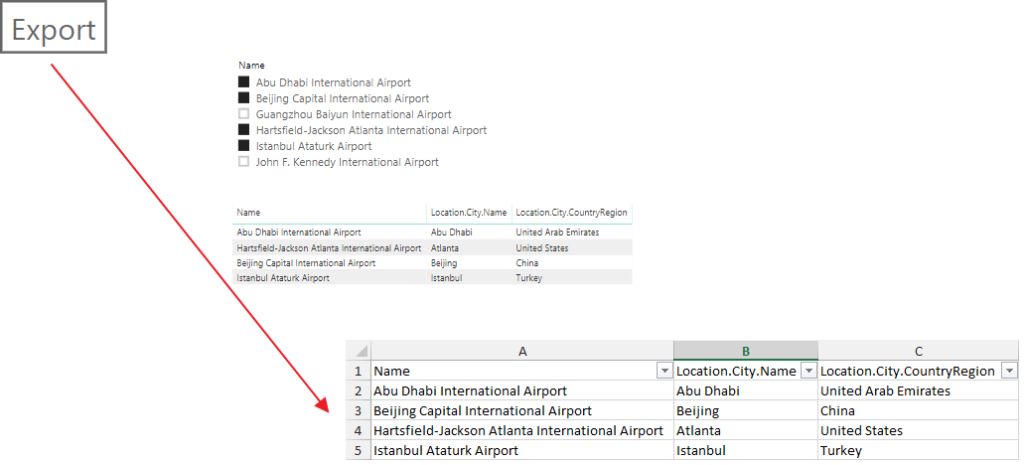
While working in Power BI desktop, we often need to export to Excel some data…
Duplicates detection in Power Query using different methods
As duplicates are a nightmare in databases, I wrote a function to identify them between…
Manage your external tools easily with Power BI Sidetools
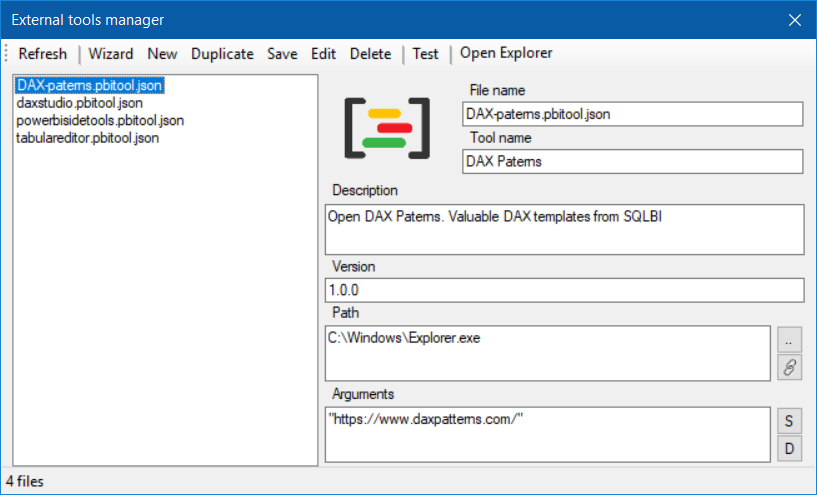
Since the Power BI team allowed to launch external tools from the Power BI desktop…
Automatic translation of tabular model
Automatic translation of tabular model using Tabular Editor and Excel is possible since the Power…
Compare DAX and M formulas in Visual Studio Code
Compare DAX and M formulas in Visual Studio Code is really easy with the help…
Power BI assistant troubleshooting
In case you cannot make Power BI assistant work, you may use Power BI assistant…
Visualize your SQL database schema within Power Query
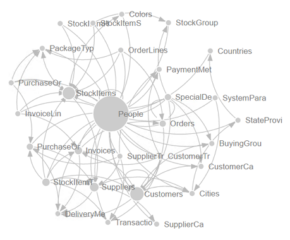
Often, we need to look for a table or for a specific column in the…
Get username function in Power Query
Get username function in Power Query with few lines of M code. For the moment,…
Visuals labels translations in Power BI reports
Visuals labels translations in Power BI reports are not supported natively. However, there is a…
Automatic translation of visuals labels
Automatic translation of visuals labels in Power BI reports is possible using conditional formating, Tabular…
Powerful text and file search in Visual Studio Code
As Power BI Sidetools creates files from your report, you are able to search through…
2. Display a light when data is filtered
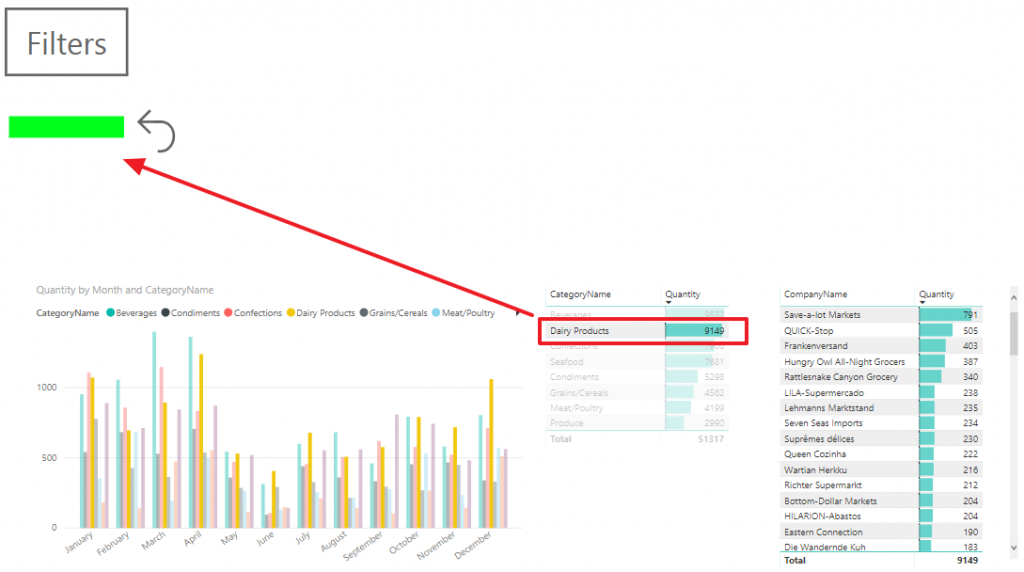
When we use a report, it’s important to know if users applied filters. So, you…
Create dynamic links in your tables
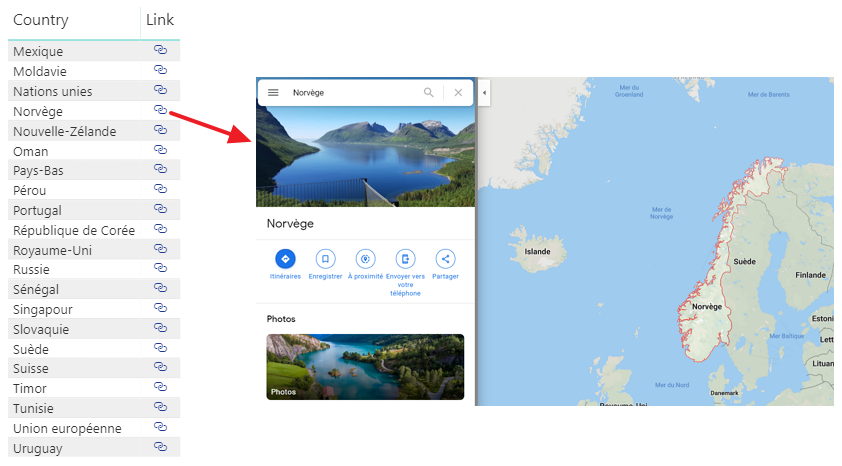
Dynamic links are urls including some ID. So by clicking on these links, the user…
Tips for map visual efficiency
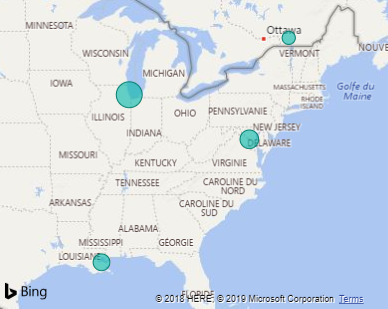
I encountered some problems to get Power BI map visual working properly. So I share…
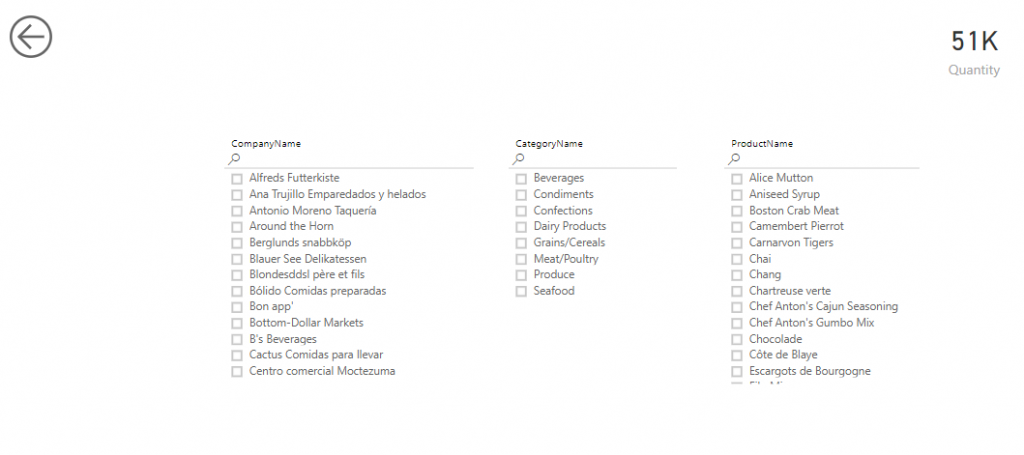
1. Add a filter page to your report
There are different ways to filter data in Power BI reports. My favorite one is…
Add data in a table from your reports
You can add data in a table or in an Excel file from your reports….
Translations life cycle management
Translations life cycle management must be considered seriously as soon as we decide to translate…


