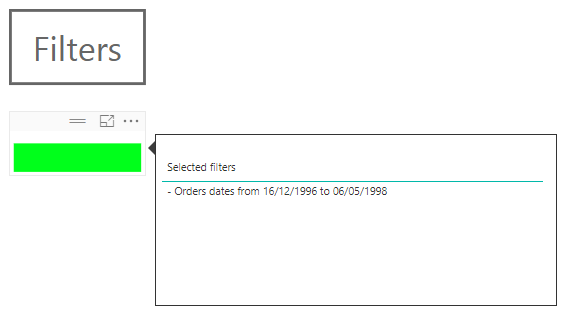
5. Add your filtered date range in the tooltip
Don’t forget to add your filtered date range in the tooltip. This is one of the most important filter to display.
How to add your filtered date range in the tooltip
- Edit the ‘Selected filters’ measure and add a new variable (Filtered_date)
Selected filters =
VAR CR_LF = "
" // This is a simple carriage return
VAR Filtered_date = "- Orders dates from " & FORMAT(MIN(Orders[OrderDate]) ; "dd/mm/yyyy") & " to " & FORMAT(MAX(Orders[OrderDate]) ; "dd/mm/yyyy") & CR_LF
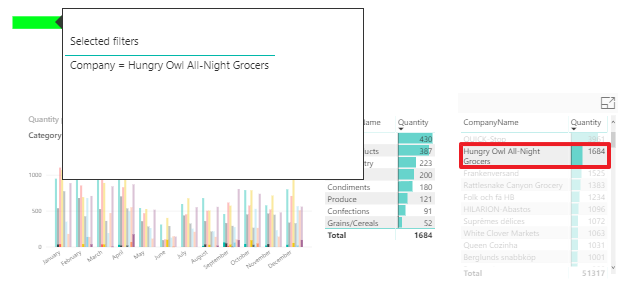
VAR Company = IF(ISFILTERED(Customers[CompanyName]) ;
"Company = " & CONCATENATEX(ALLSELECTED(Customers[CompanyName]) ; Customers[CompanyName] ; " , ") & CR_LF ; "")
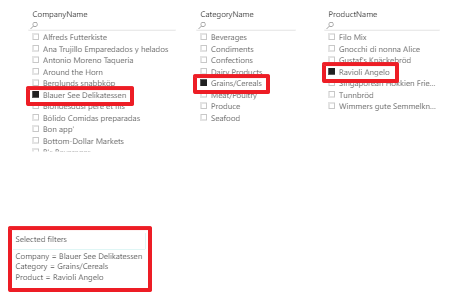
VAR Category = IF(ISFILTERED(Categories[CategoryName]) ;
"Category = " & CONCATENATEX(ALLSELECTED(Categories[CategoryName]) ; Categories[CategoryName] ; " , ") & CR_LF ; "")
VAR Product = IF(ISFILTERED(Products[ProductName]) ;
"Product = " & CONCATENATEX(ALLSELECTED(Products[ProductName]) ; Products[ProductName] ; " , ") & CR_LF ; "")
RETURN Filtered_date & Company & Category & Product You may adapt the date format to your needs.
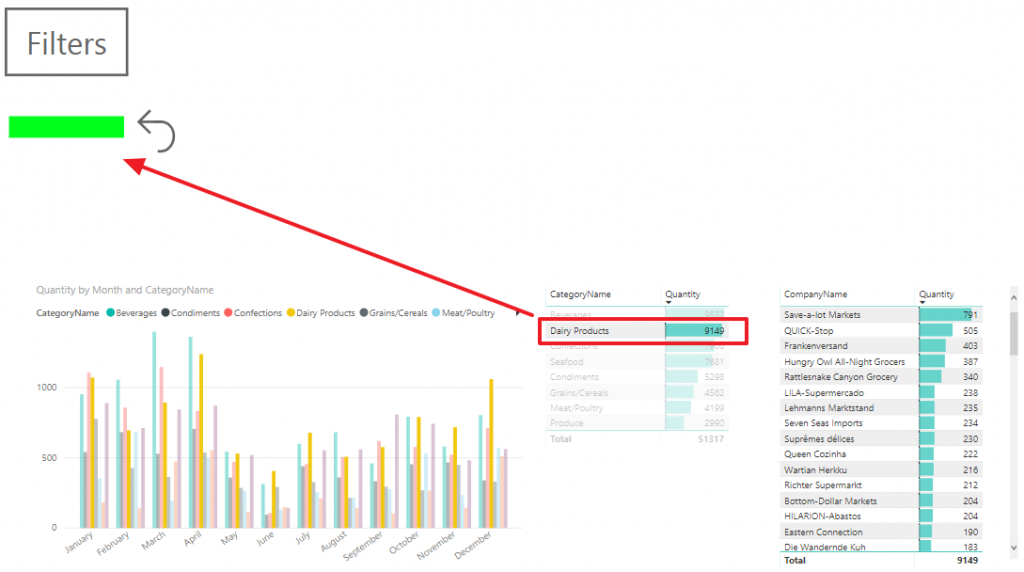
From now on, the date range filter will appear in any page you desire.
Tips
You may even create a dedicated measure for the date range filter and display it in all your pages or in the title of some visuals.
Here is the pbix file of the demo : download demo ‘Report filters.pbix’
This post is a part of a series : see the series
4. Add a tooltip to display applied filters
Once you know your report is filtered having a look at the green light, you…
3. Display filters applied to data
To understand properly our data, the very first thing we need to do is to…
2. Display a light when data is filtered
When we use a report, it’s important to know if users applied filters. So, you…
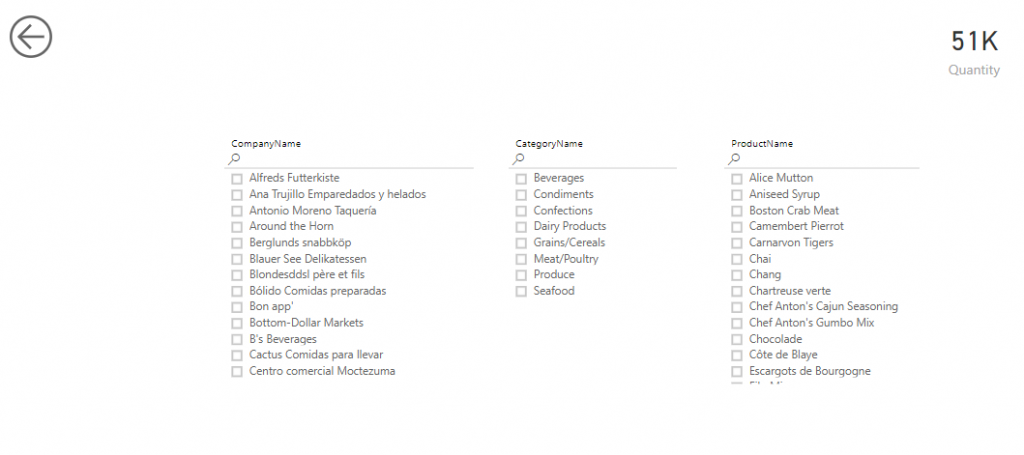
1. Add a filter page to your report
There are different ways to filter data in Power BI reports. My favorite one is…