Visuals labels translations in Power BI reports
Visuals labels translations in Power BI reports are not supported natively. However, there is a trick using conditional formating which does the job. The most used visual labels are titles so I will focus on this kind of label in this post.
Steps to translate visuals titles

Create a table with the translations including an ID column (here the ID column is the “Reference text”)
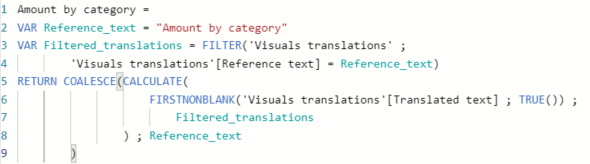
Create a DAX measure by visual. This measure will look for the translation according to an ID value
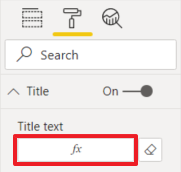
For each visual, open the formating pane then activate and develop the “Title” option. Click on the “fx” button besides the “Title text” field to add conditional formating. Then select the DAX measure
DAX measure for text conditional formating
I found 3 methods to get the translated text. Both of them have pros and cons. Please, give your opinion and share other methods.
- Use a slicer to filter the language
- This way, you can test different languages easily but the end user needs also to select his language
- Use the “USERCULTURE()” function to filter the language
- No selection is needed because it uses the “Application language” in the global regional settings
- This function works with some limitations (see down below) and it is not supported by Microsoft for the moment even if it works in some cases
- This is my favorite method. I’m just waiting for Microsoft to support it totally
- Use row level security to filter the language
- I didn’t explore this possibility yet because I don’t want to maintain a table to make a correspondance between users and languages
Tabular editor script to create translation measures automatically
You understood that you need to create as many measures as visual titles you want to translate. It might be tedious. As Tabular Editor allows to create measures with a script, we will save a lot of time using a script like the one I propose. The script reads a tsv file (tab separated values) which contains measures names. A tsv file example is joined to the script :
Create visuals translations measures
Read measures list from report layout
The list of measures can be created automatically reading the report layout in the pbix/pbit file. In this post I describe how to create/update the list with no effort. I describe also how to translate visual titles automatically : https://thebipower.fr/index.php/2020/05/10/automatic-translation-of-visuals-labels/
In a future post, I will explain how to maintain translations along the life of the report.
Limitations
The following documentation from Microsoft describes how to and advices on several limitations.
Expression based titles in Power BI desktop : https://docs.microsoft.com/fr-fr/power-bi/desktop-conditional-format-visual-titles
This Power BI community post describes the temporary limitations of the “USERCULTURE()” DAX function : https://community.powerbi.com/t5/Service/USERCULTURE-works-only-for-reports-implemented-with-import-mode/m-p/859004
As long as the XMLA endpoint read/write access is in preview mode, I don’t recommend to use it in production. However, the solution above works so feel free to try on test reports
Some labels are not able to use conditional formating : textbox text, visual header tooltip, page name
Conclusion
So visuals labels translations are possible in Power BI reports. This does not concern the model translation. To translate name of columns, measures, display folders, … please have a look at this post : https://thebipower.fr/index.php/2020/04/12/automatic-translation-of-tabular-model/
Translations life cycle management
Translations life cycle management must be considered seriously as soon as we decide to translate…
Automatic translation of visuals labels
Automatic translation of visuals labels in Power BI reports is possible using conditional formating, Tabular…
Automatic translation of tabular model
Automatic translation of tabular model using Tabular Editor and Excel is possible since the Power…
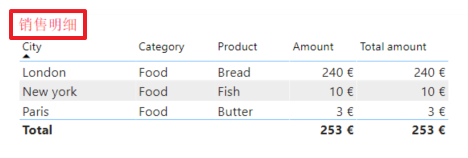
Is there a way to create multilingual visuals such a pie chart and have the labels change dynamically based on a language selection slicer?
Yes, this is exactly the purpose of this post