1. Add a filter page to your report
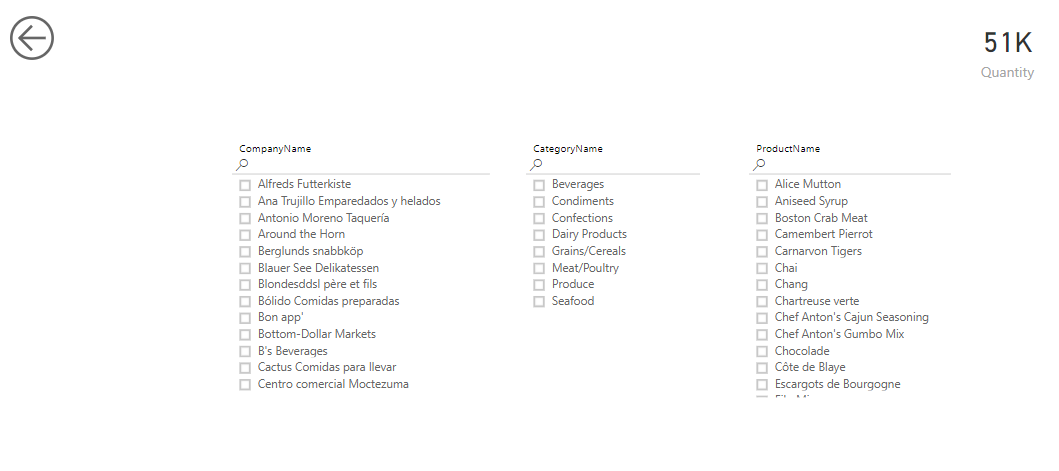
There are different ways to filter data in Power BI reports. My favorite one is to create a specific filter page containing many slicers. These filters will be applied to the whole report or to a part of it. In next posts, I will show you how to display the applied filters in pages.
How to add a filter page to your report
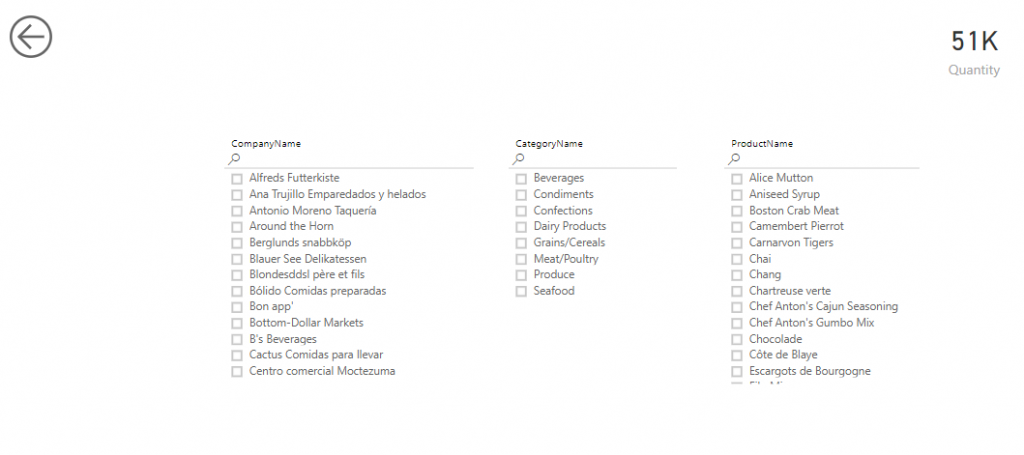
- Add a page to the report and name it ‘Filters’
- Optionally, you may hide this tab
- Add in the page:
- some slicers
- a card to display the number of rows which are filtered
- a ‘Back’ button
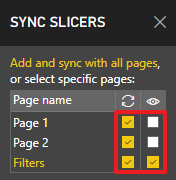
- Open the ‘Sync slicers’ pane
- Synchronise each slicer on each page
- Chose to display a slicer or not on other pages
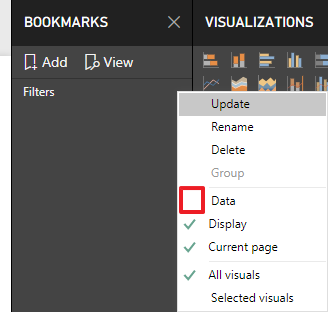
- Open the ‘Bookmarks’ pane
- Add a bookmark and name it ‘Filters’
- Uncheck the ‘Data’ option

- On other pages, add a blank button
- In the ‘VISUALIZATIONS’ pane, activate the ‘Button text’ option
- Type ‘Filters’ in the ‘Button text’ field
- Increase the ‘Text size’
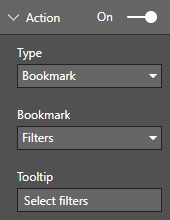
- Activate the ‘Action’
- Select ‘Bookmark’ type
- Select ‘Filters’ bookmark
- Optionally type a tooltip
- On other pages, add some visuals
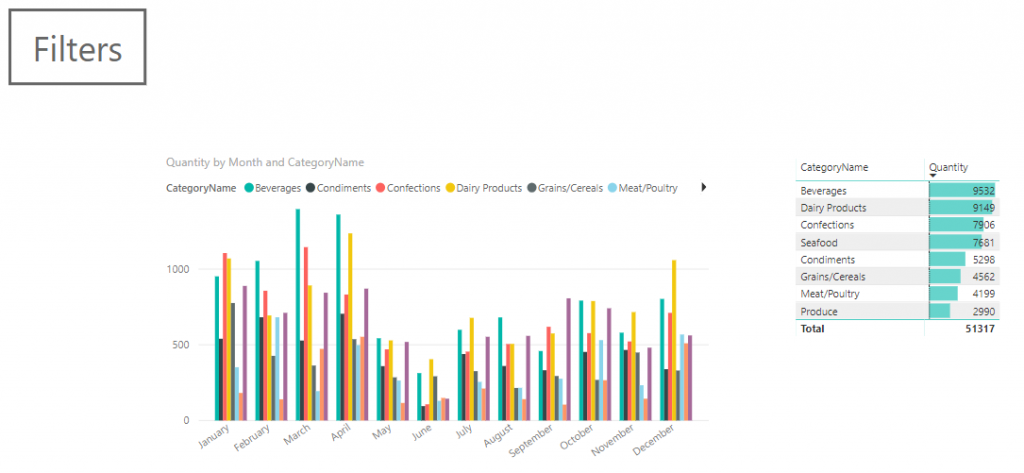
Then, you can control click on the ‘Filters’ button, select some filters, control click on the ‘Back’ button and look at the effect on other pages.
How to add a ‘Reset filters’ button (optional)
- Go to the ‘Filters’ tab
- Remove all filters
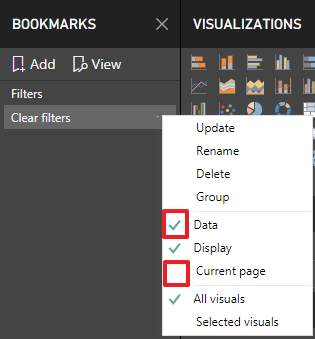
- Add a bookmark and name it ‘Clear filters
- Keep the ‘Data’ option checked
- Uncheck ‘Current page’
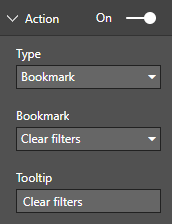
- Add a ‘Reset’ button
- Activate the ‘Action’
- Select ‘Bookmark’ type
- Select ‘Clear filters’ bookmark
- Optionally type a tooltip
- Copy and paste this button to other pages
- Try the ‘Reset’ button in all pages
Here is the pbix file of the demo : download demo ‘Report filters.pbix’
This post is a part of a series : see the series – see next post
5. Add your filtered date range in the tooltip
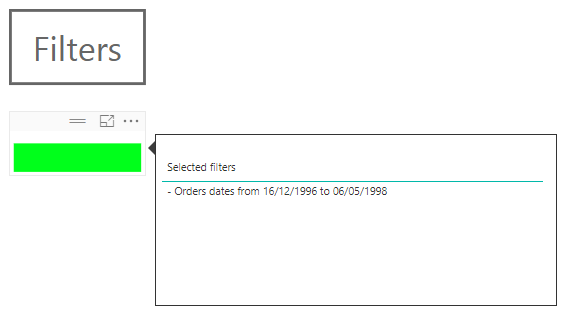
Don’t forget to add your filtered date range in the tooltip. This is one of…
4. Add a tooltip to display applied filters
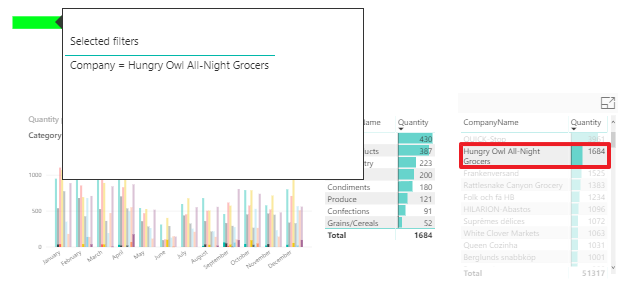
Once you know your report is filtered having a look at the green light, you…
3. Display filters applied to data
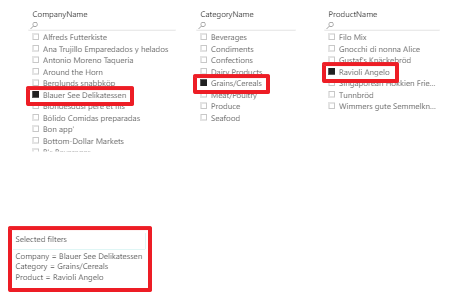
To understand properly our data, the very first thing we need to do is to…
2. Display a light when data is filtered
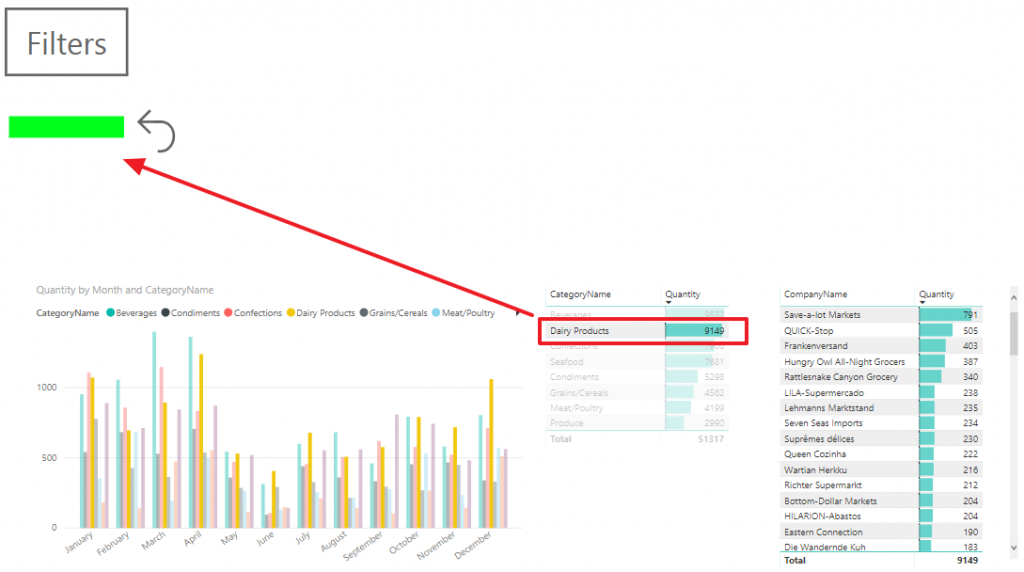
When we use a report, it’s important to know if users applied filters. So, you…

Syncing slicers across pages is fantastic, but the feature is not currently supported when you embed the report on a web page, FYI.
Thank you Mike for the information! That’s really a pity. I will try
Mike, I added a sample report in this post and it seems to work. Additionally, I embedded the report in SharePoint and it works there also. Can you explain what doesn’t work exactly ?
Hi Didier – I was able to create a new dashboard and tested as well, and confirmed it works! I did some research and couldn’t find much about it from Microsoft, but did see when they introduced the features that embedded wasn’t supported. Somewhere along the way, it’s now supported and I’m not angry about it! Such a great, and needed feature for how we build and use Power BI reports.
Thank you for the great article, I hope your readers find similar value in the feature!