
2. Display a light when data is filtered
When we use a report, it’s important to know if users applied filters. So, you can display a light when data is filtered.
How to display a light when data is filtered
- First, you create a measure to detect an active filter :
Is table filtered = IF(COUNTROWS(Order_Details) = COUNTROWS(ALL(Order_Details)) ; 0 ; 1)- And you create an other measure to detect inactive filters :
Is table not filtered = IF([Is table filtered] ; 0 ; 1) - And then, create a fake column :
Fake column = "?" 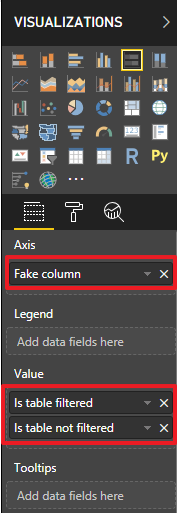
- Add a 100% stacked bar chart to your report and set it up this way. It will display a light when data is filtered
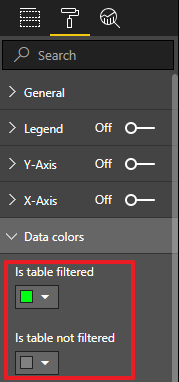
- In the format pane, modify data colors
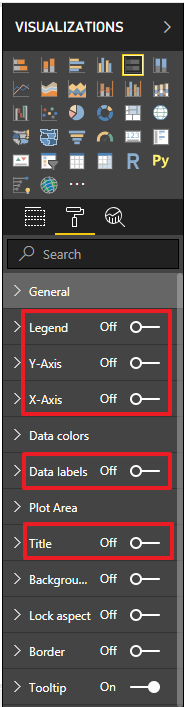
- and setup options this way
From now on, when you will apply any filter, the ligth will turn to green. You can try by selecting any filter in the ‘Filters’ page or by selecting a category in your visuals
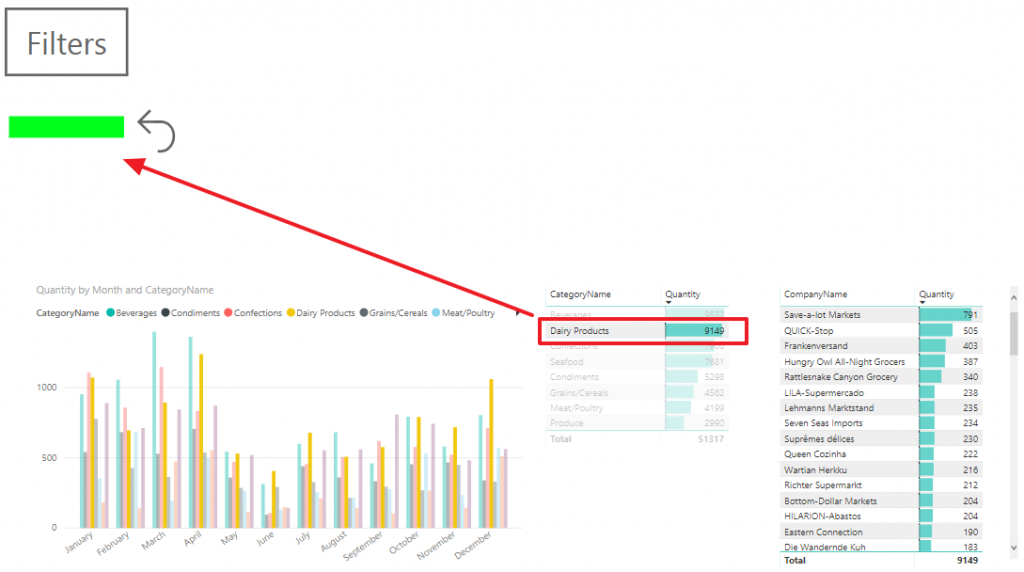
And then, you may try to click on the reset button.
In conclusion, if you turn on a light when data is filtered, you will catch the attention of your users on the filters they applied. In the next post, you will display these active filters to avoid your users to ask you about it.
Here is the pbix file of the demo : download demo ‘Report filters.pbix’
This post is a part of a series : see the series – see next post
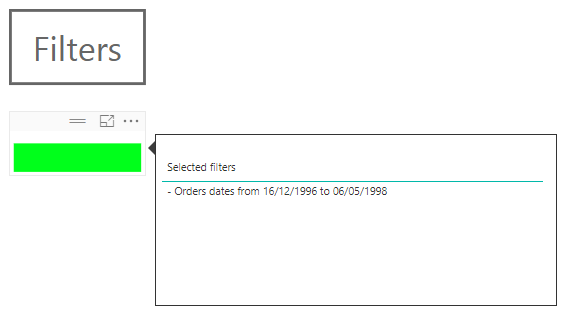
5. Add your filtered date range in the tooltip
Don’t forget to add your filtered date range in the tooltip. This is one of…
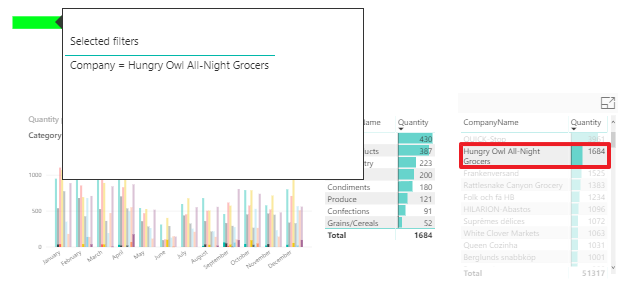
4. Add a tooltip to display applied filters
Once you know your report is filtered having a look at the green light, you…
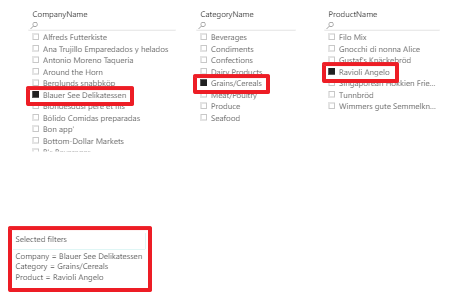
3. Display filters applied to data
To understand properly our data, the very first thing we need to do is to…
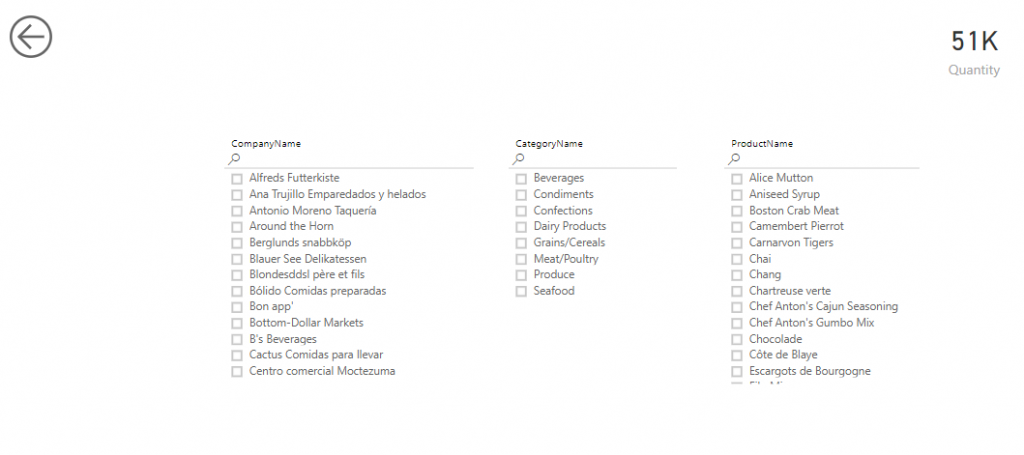
1. Add a filter page to your report
There are different ways to filter data in Power BI reports. My favorite one is…