4. Add a tooltip to display applied filters
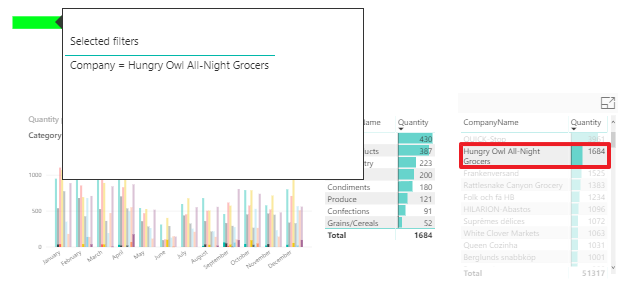
Once you know your report is filtered having a look at the green light, you expect to get more details. So add a tooltip to display applied filters.
How to add a tooltip to display applied filters
- Create a tooltip page, name it ‘TT filters’ and hide this page. See this blog post if you don’t know how : create a tooltip page
- Add a table visual to your ‘TT filters’ page and maximize it to the tooltip size
- Add the ‘Selected filters’ measure to the table
- Set the header width of the table to be not automatic and adjust the width manually
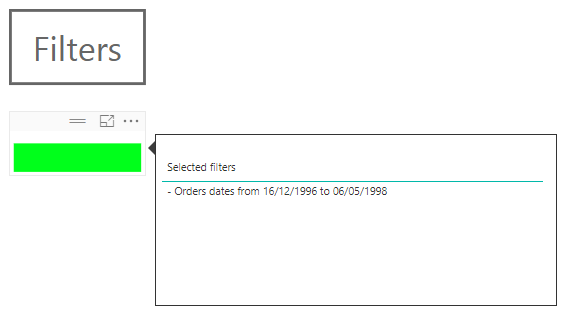
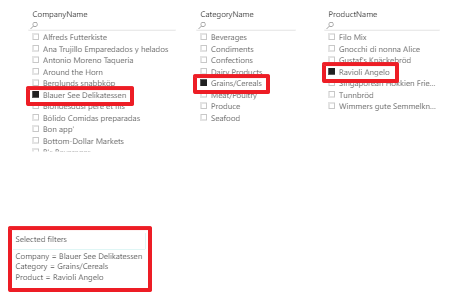
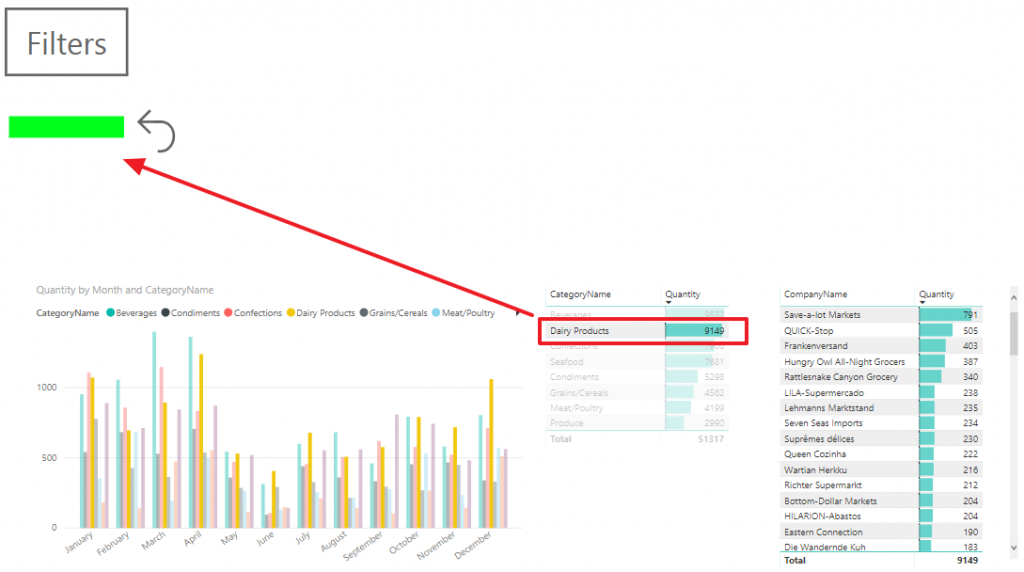
From now on, when your mouse hovers the green light, the ‘TT filters’ tooltip will appear showing the applied filters. It will work with any filter. Cross highlighting or cross filtering, slicers, page & report filters in the visualization pane or in the filter pane will work.
Your users will not ask you anymore how the report is filtered. They will simply open the tooltip to display applied filters.
Tips
A good practice is to display at least the green light near your KPIs to alert managers on the filtered context. Otherwise, you may display the whole applied filters like we did in the ‘Filters’ tab.
If you export your report to PDF, an other good practice is to show your applied filters in one of the first pages then your report will be auto documented.
Here is the pbix file of the demo : download demo ‘Report filters.pbix’
This post is a part of a series : see the series – see next post
5. Add your filtered date range in the tooltip
Don’t forget to add your filtered date range in the tooltip. This is one of…
3. Display filters applied to data
To understand properly our data, the very first thing we need to do is to…
2. Display a light when data is filtered
When we use a report, it’s important to know if users applied filters. So, you…
1. Add a filter page to your report
There are different ways to filter data in Power BI reports. My favorite one is…

